Repulsive-Point-Thermo-Elasticity
for Solids at Extreme Pressures and Temperatures based on Shear
An Excellent Way to predict the Elastic Properties of Solids
An Important Method to Measure Pressure and Temperature in Solids
The Graphs Below Highlight a Selection of the Materials Studied
updated on October 30, 2023
Repulsive point
thermo-elasticity is used in reference [8] to describe the temperature and
pressure dependence of the shear modulus in solids. The figures posted are based on a completely
new constitutive law: the shear modulus only depends on the volume as a
state-variable of the solid. The volume
in-turn is dependent on the temperature and the pressure. Swenson’s law from 1968 states that the ‘shear
modulus of a solid does not depend on temperature or pressure when the specific
volume is held constant’. This implies
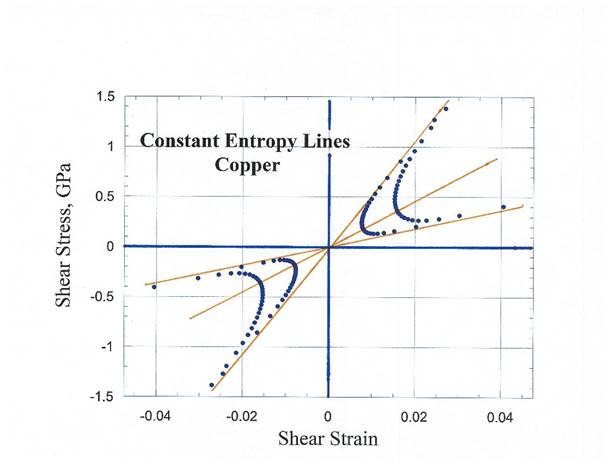
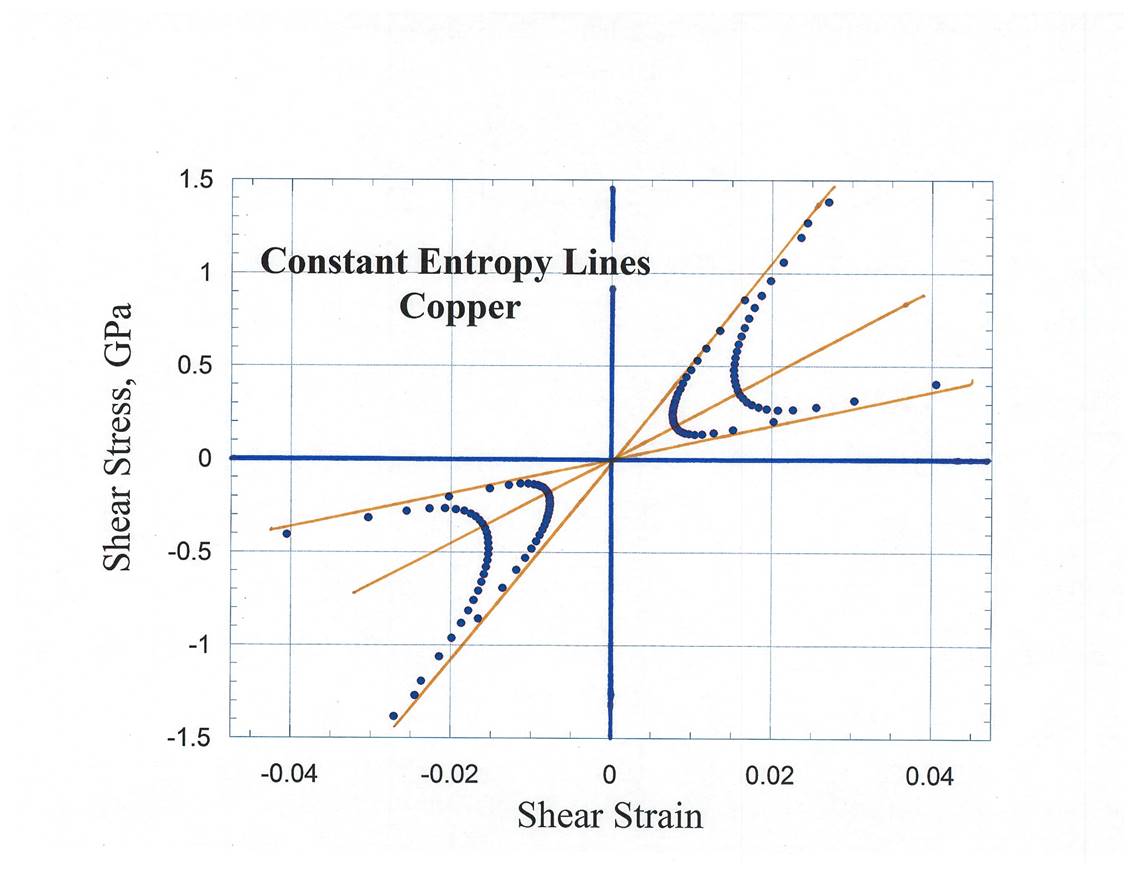
that the entropy lines in shear stress vs shear strain at selected temperatures
are going to cross which is not possible.
The entropy lines in shear are pushed away from the point where the
isothermal lines cross i.e., zero shear stress and zero shear strain point.
There is now a growing
body of evidence of the applicability of this ‘universal modulus law’ in a wide
selection of materials including metals, ceramics, minerals and (soon to be
investigated polymers and glasses). The
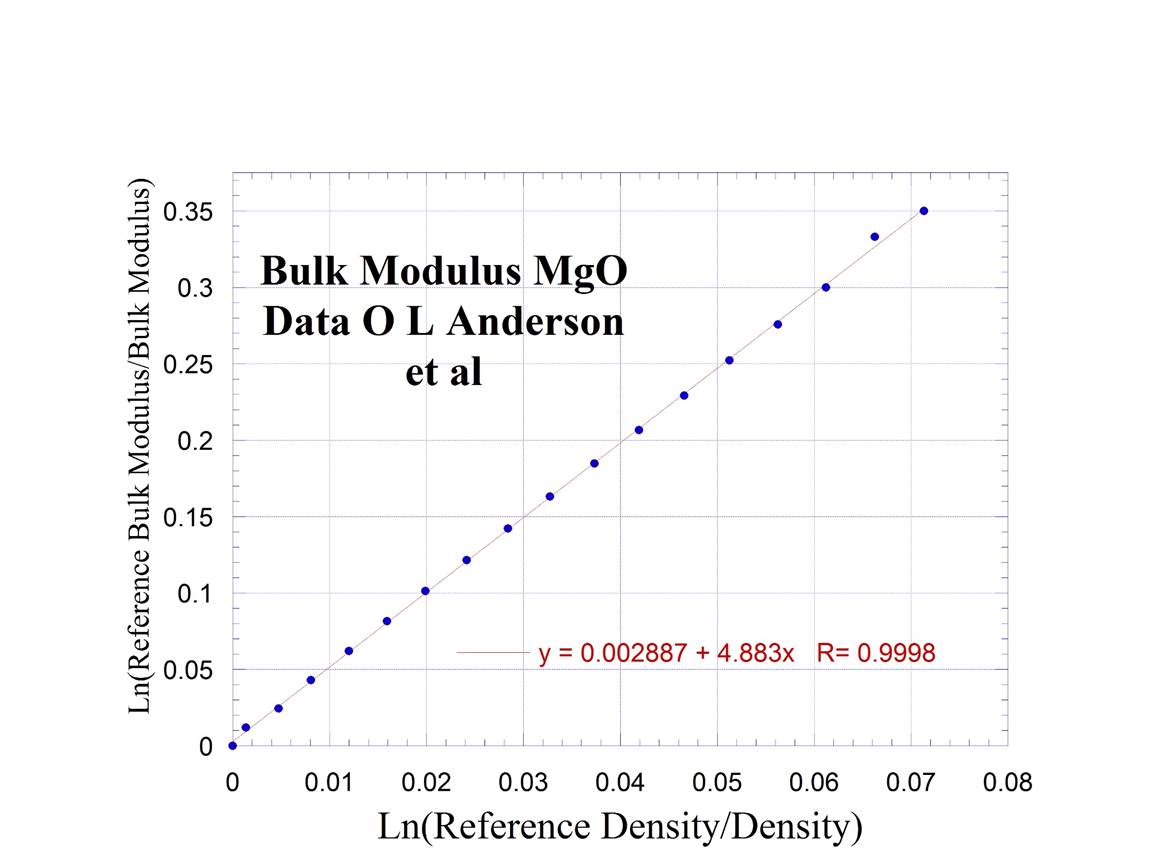
bulk moduli in some single-phase, elemental metals, Na, Cu, Au and Ag were used to establish
that the law is truly universal. The
rule to follow is that the material must support a shear stress, i.e., behave
as a solid.
Go to the materials
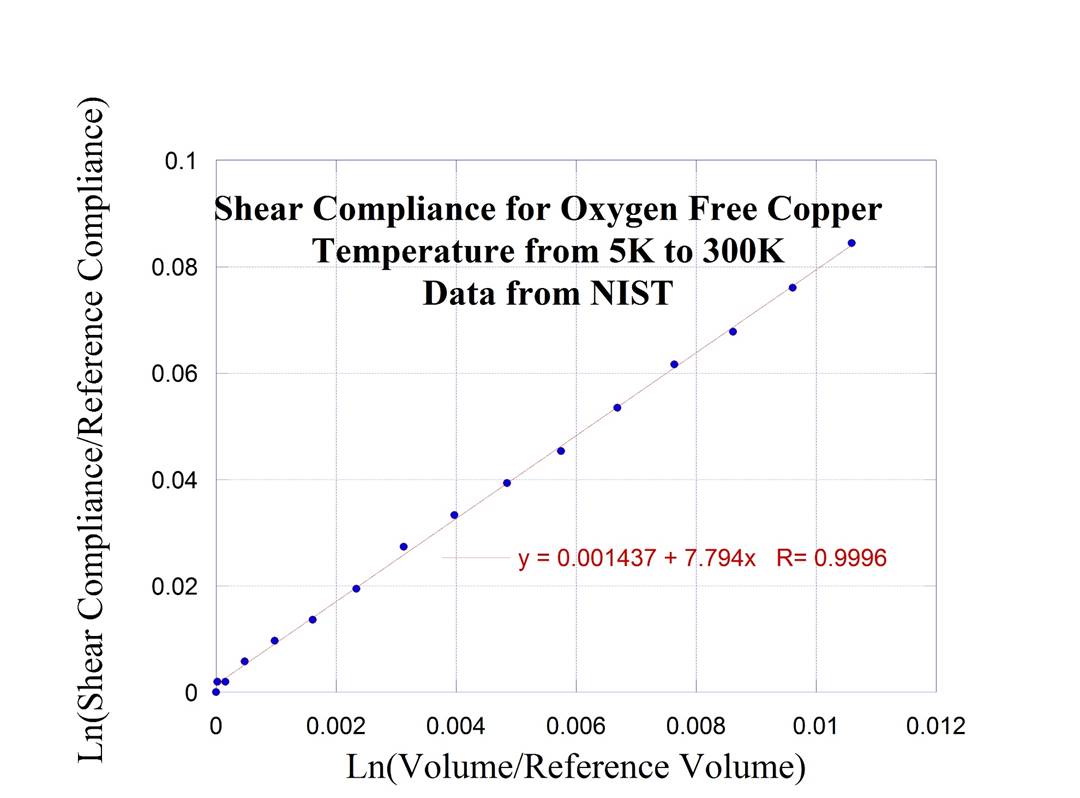
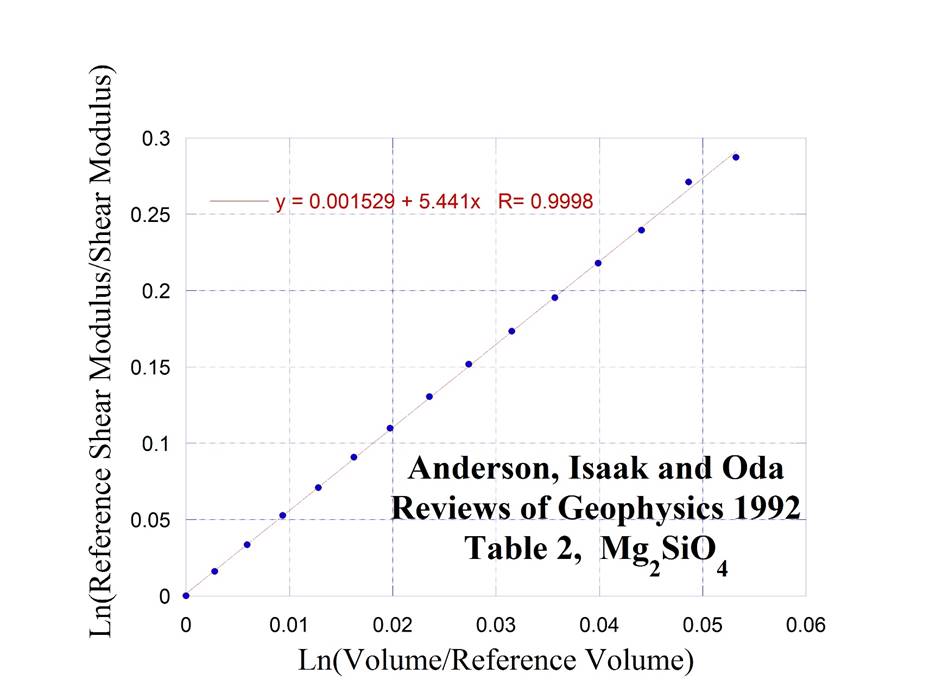
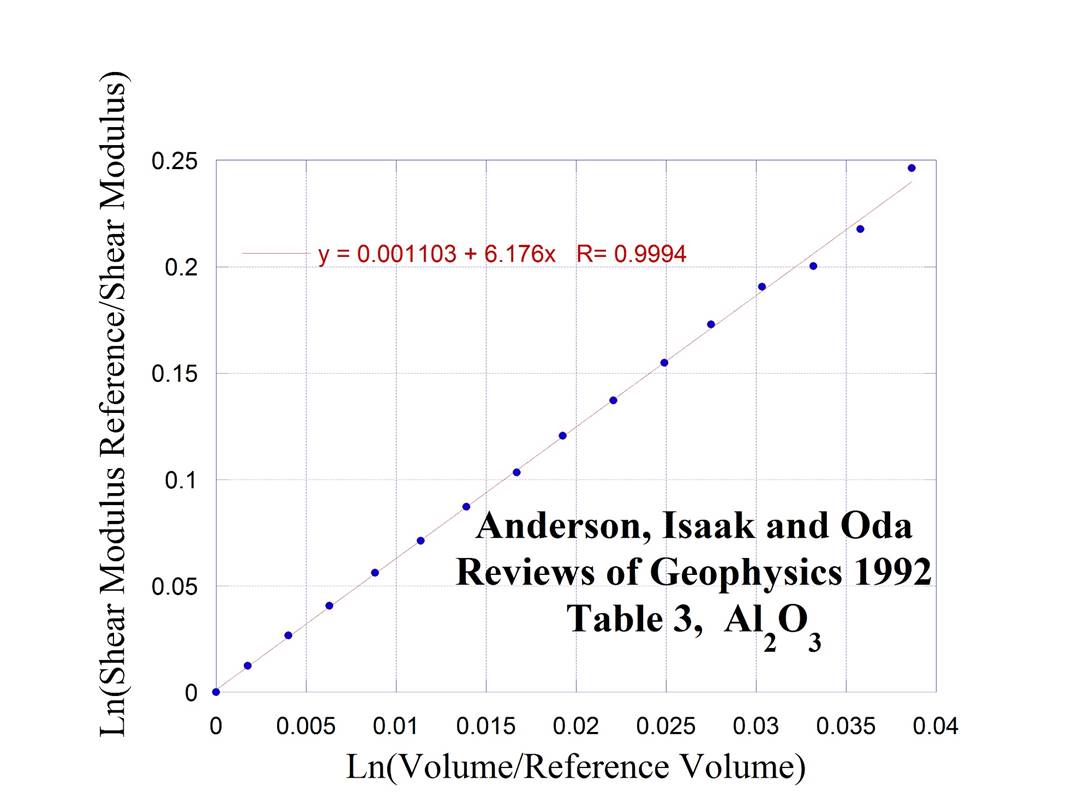
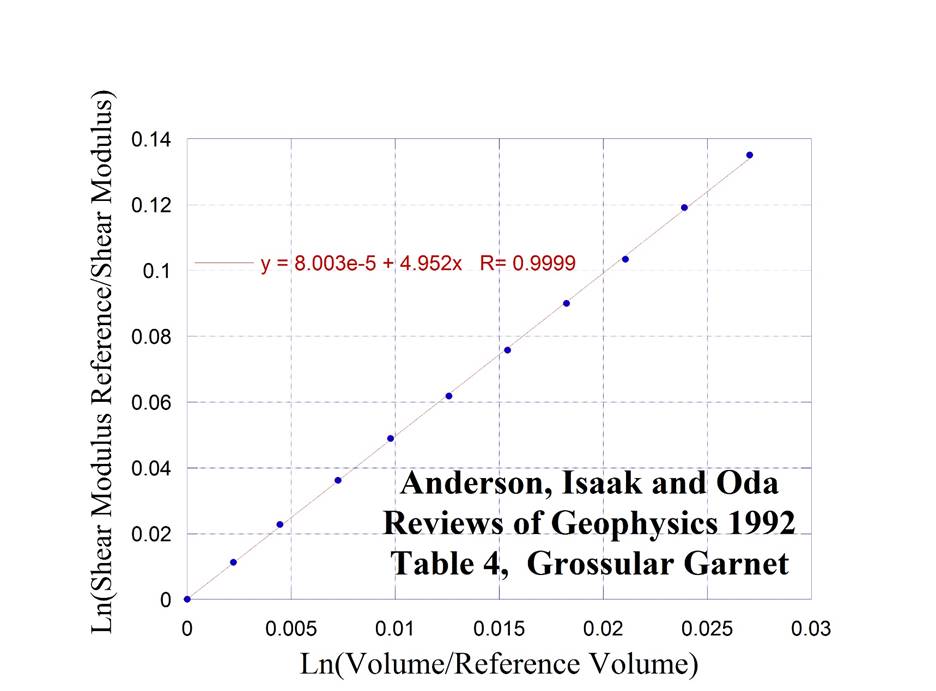
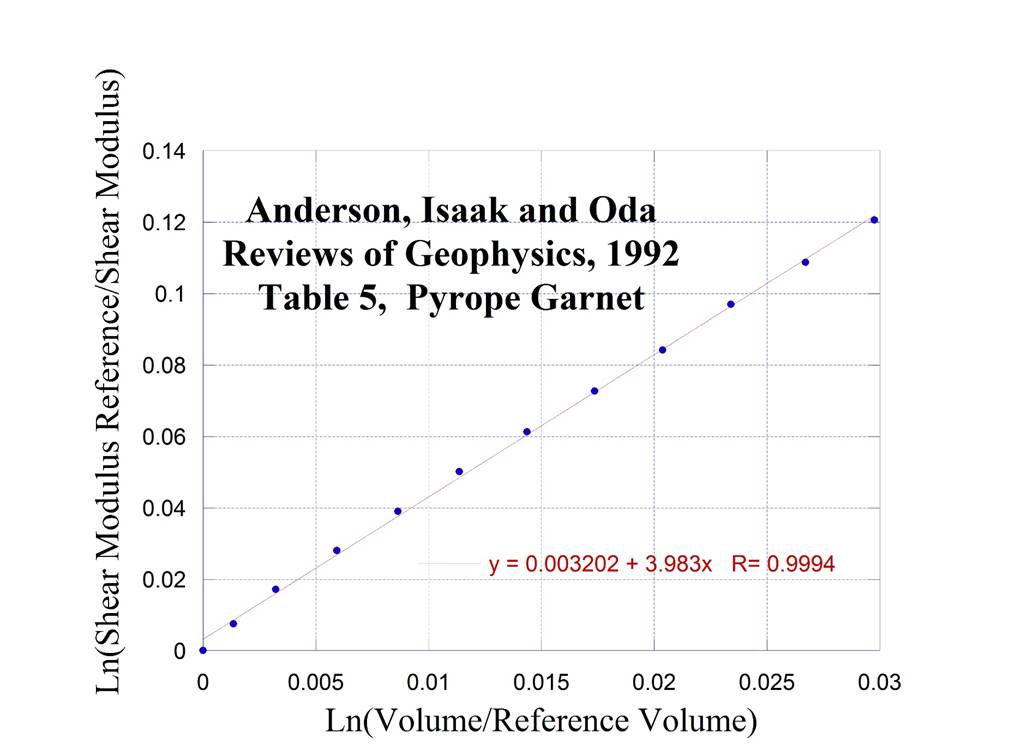
listed below for some of the materials studied {I now have an additional 20 materials in September 2022} I have constructed plots of the log natural
(Compliance/Reference Compliance) versus the log natural of the (Volume/Reference
Volume).
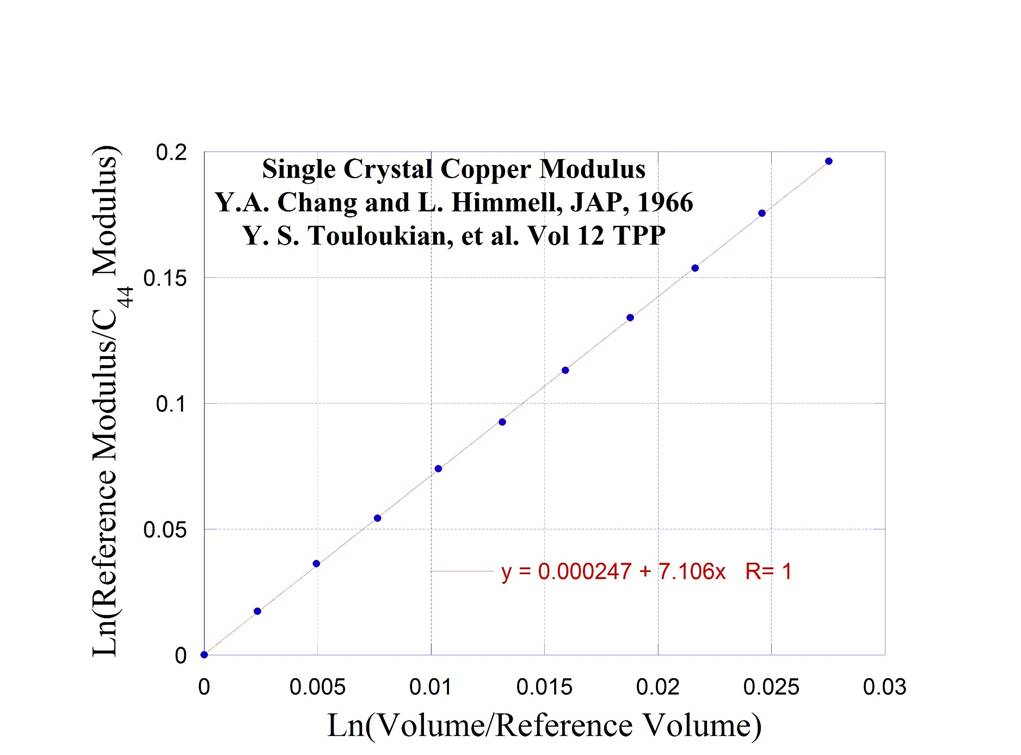
1.
Copper
2.
Ringwoodite
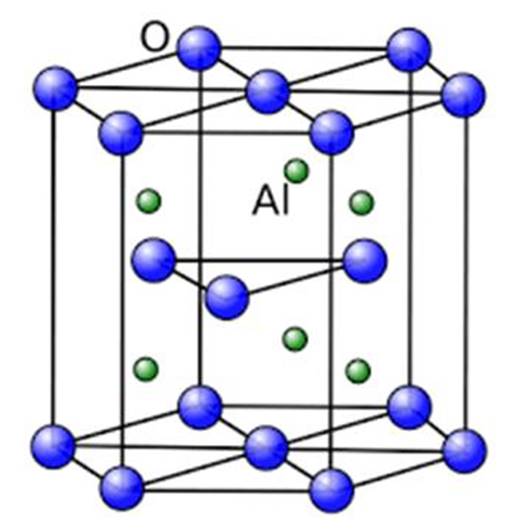
3.
α Alumina
4.
Grossular Garnet
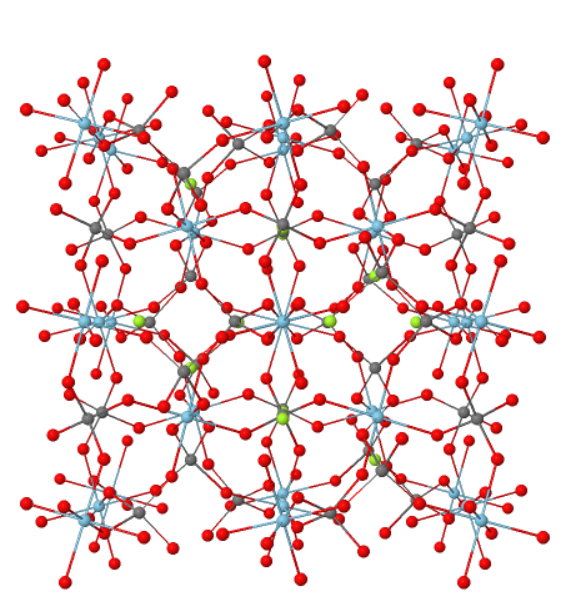
Garnet – Ca3Al2Si3O12 – Grossular
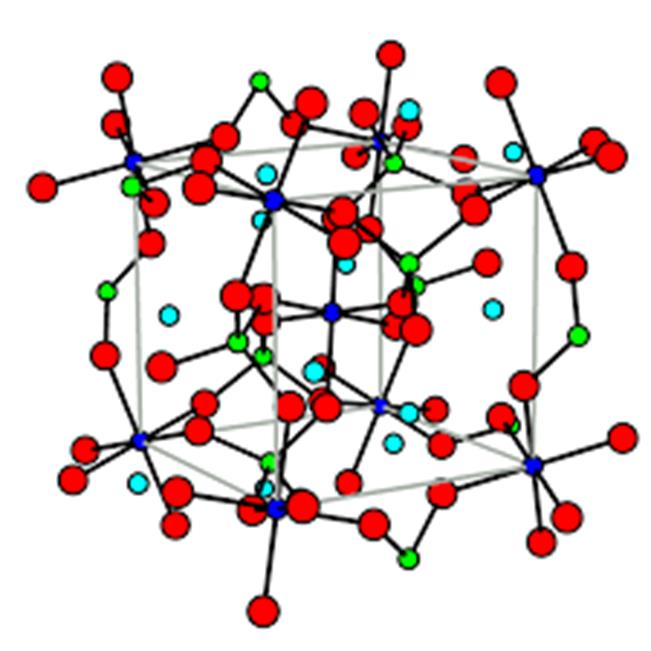
5. Pyrope Garnet
6.
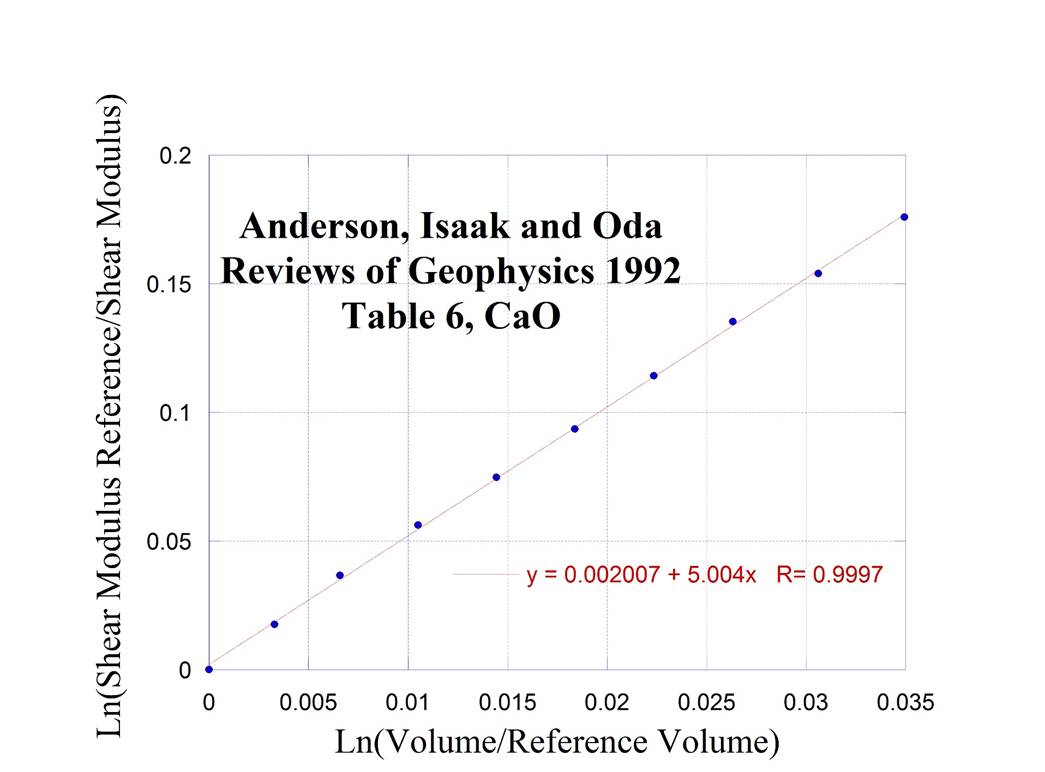
Quicklime
or CaO

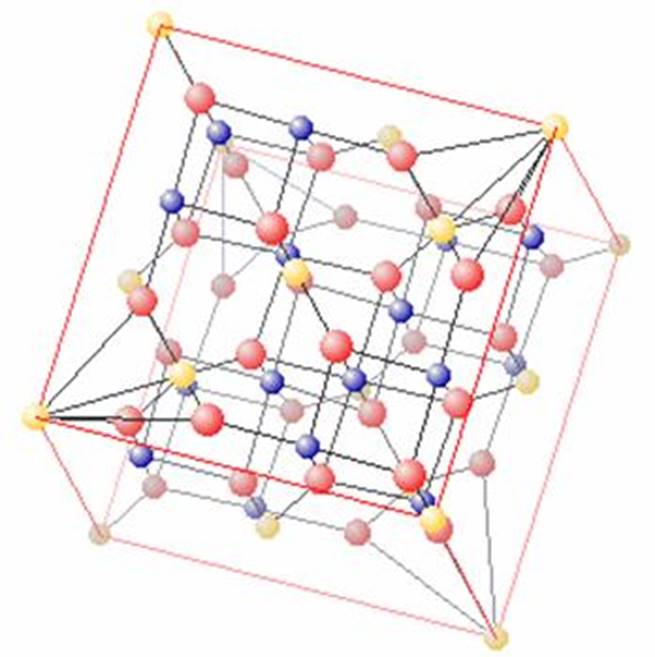
7.
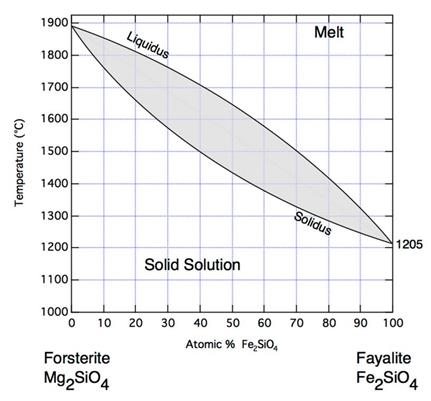
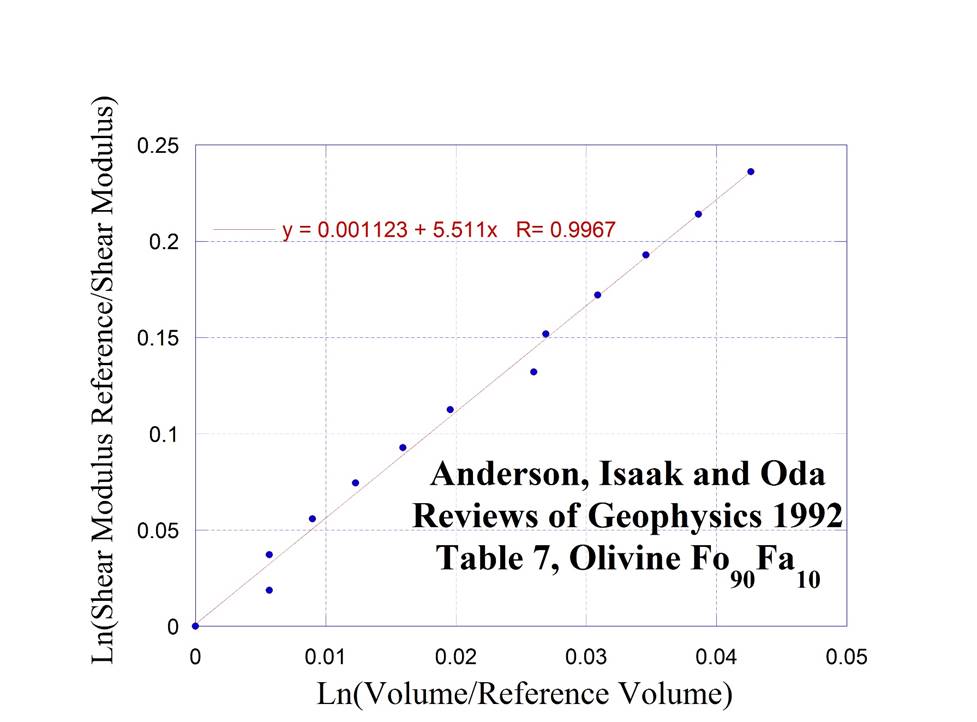
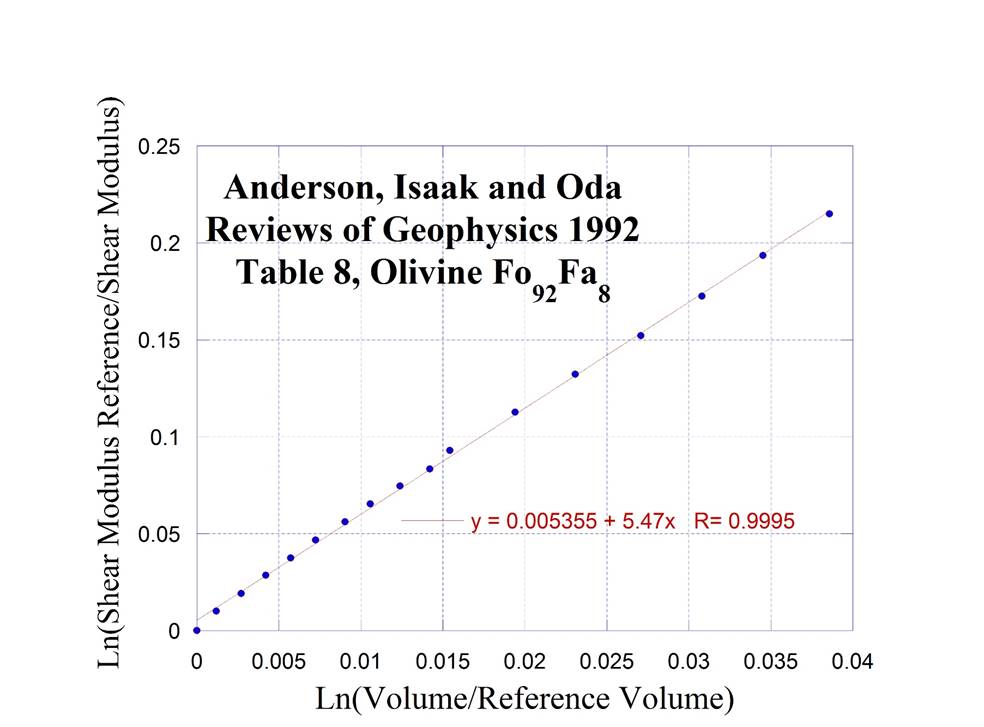
Forsterite
and Fayalite are a solid solution on the temperature composition axis
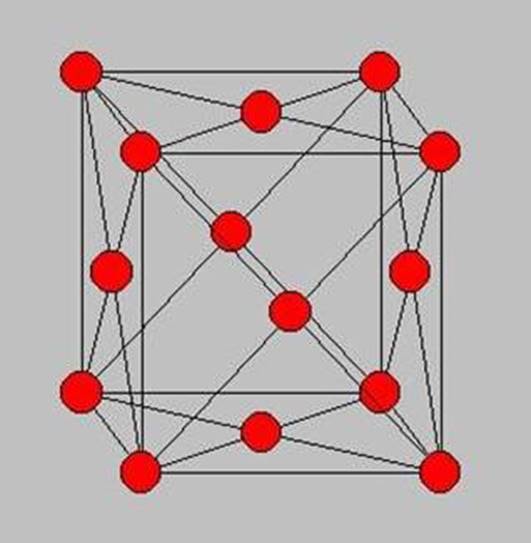
On
the pressure composition axis the (Mg, Fe)2SiO4
system forms Olivine I and Olivine II compositions

Olivine I

Olivine II (with
a slightly different composition in Fe see structure in Olivine I)
8.
Periclase
or Polycrystalline MgO
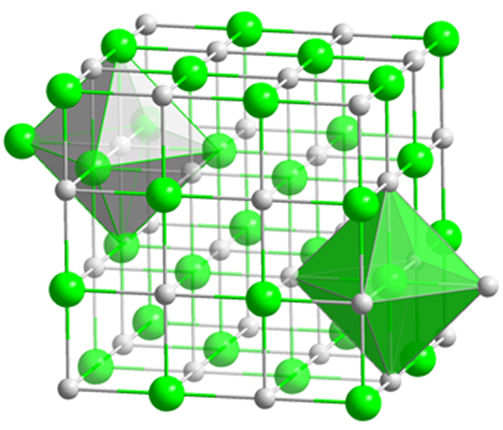
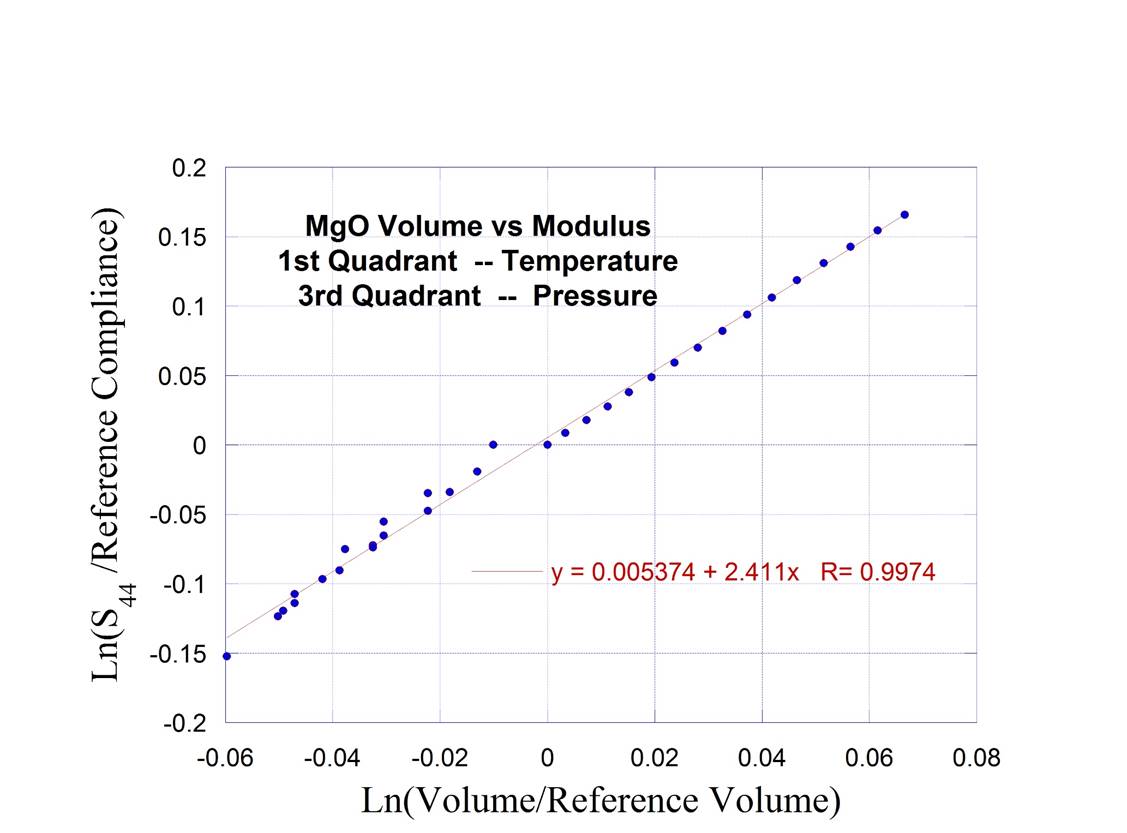
9.
Single
Crystal MgO (with
temperature and pressure parametrically on same graph)
10. Single
Crystal Copper at High Temperature (see #1 for
polycrystalline copper at low temperature)
11. Construction
of Constant Shear Entropy Lines for Copper
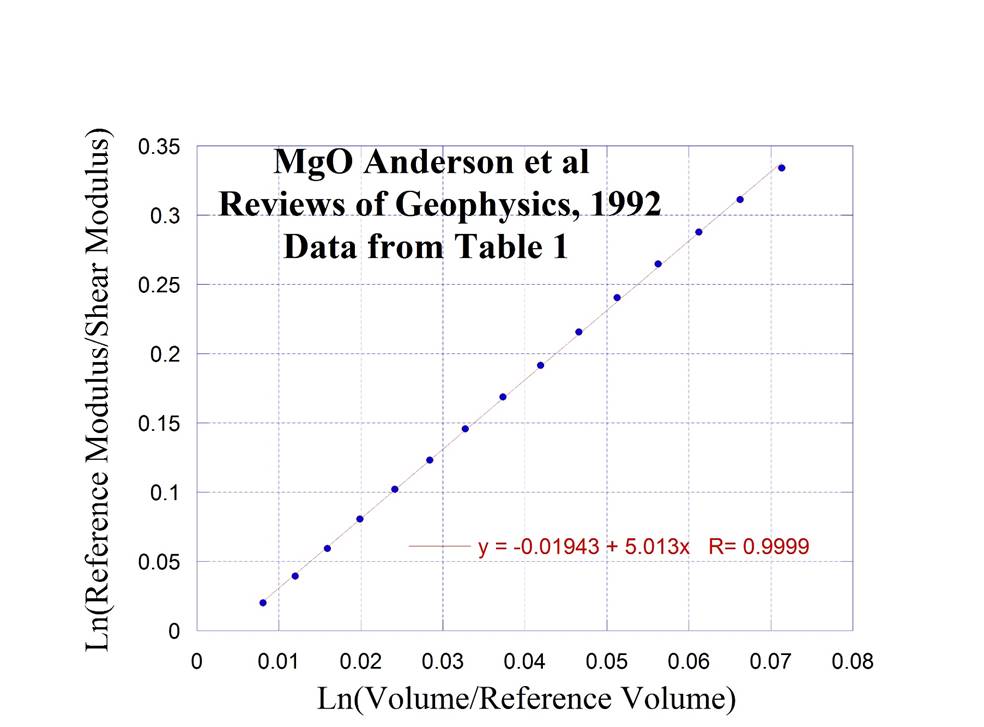
12. Bulk
Modulus from Polycrystalline MgO