
Team Members
Runtao Zhou, Qihao Yun, Jiahang Wu, Zhengyuan Wang, Mengmeng Yu
Project Sponsor
Dr. Zidian Xie
Project descriptions and motivation
Our project aims to explore the public’s perception of marijuana/cannabis in the US through Twitter data analysis. We aim to achieve four objectives, namely gaining insights into public perception of marijuana, investigating the topics discussed in marijuana-related tweets, and understanding the demographic profile of marijuana users and analyzing how changes in policy affect the perception of marijuana users or general Twitter users.. To accomplish those objectives, we used advanced techniques such as the Bidirectional Encoder Representations from Transformers (BERT) model to predict sentiment scores, LDA to group topics, and DeepFace facial recognition system to extract demographic information. Through this project, we hope to contribute to a better understanding of the complex issues surrounding marijuana use and inform policy decisions.
Dataset
Our project sponsor Dr. Xie gathered the data used in this project using Twitter’s streaming Application Programming Interface (API). By searching for keywords related to opioids and marijuana, information pertaining to each individual tweet was collected from February 26th, 2022, to February 11th, 2023. The tweet data was stored in six text files as JSON objects, comprising a total of 63,029,489 tweets.
Our project sponsor Dr. Xie gathered the data used in this project using Twitter’s streaming Application Programming Interface (API). By searching for keywords related to opioids and marijuana, information pertaining to each individual tweet was collected from February 26th, 2022, to February 11th, 2023. The tweet data was stored in six text files as JSON objects, comprising a total of 63,029,489 tweets.
Model
As all the data obtained from the sponsor was unlabeled, we were required to manually label each tweet in our dataset with two distinct attributes: sentiment score and marijuana user. The sentiment score attribute had three discrete labels: a score of 1 indicated a positive sentiment, 0 indicated a neutral sentiment, and -1 indicated a negative sentiment. In addition to labeling sentiment scores, we also labeled tweets’ marijuana user attributes based on their content. If we determined that the tweet’s owner was a marijuana user, we assigned a label of 1 to the tweet’s marijuana user attribute. Conversely, if we determined that the tweet’s owner was not a marijuana user, we assigned a label of 0. Since our dataset contains almost 4 million tweets and it is unrealistic to label every single tweet, we randomly sampled 5000 tweets and each member of our project group labeled 1000 tweets.
we aim to incorporate advanced deep learning models into our project. Previous research has shown that the BERT (Bidirectional Encoder Representations from Transformers) model performs well in text classification tasks [13]. To achieve optimal results efficiently, we opted for the pre-trained BERT-large-uncased model with 24 layers and 340 million parameters, compared to the 12 layers and 110 million parameters of BERT-base-uncased. The increased number of layers and parameters in BERT-large-uncased enables it to capture more intricate patterns and relationships in textual data, resulting in improved performance on language-related tasks. We customized the BERT-large-uncased model for our specific dataset to predict sentiment scores and classify marijuana users by adding linear and dropout layers to ensure the correct output shape.
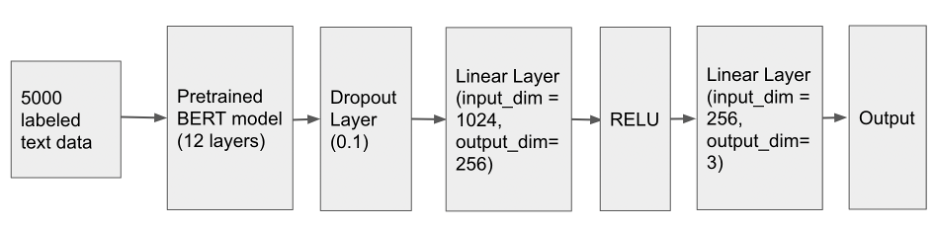
To optimize our model’s performance, we employed hyper-parameter tuning by conducting a grid search on the batch size and learning rate of our BERT-based model. The purpose of this search was to find the combination of hyper-parameters that resulted in the highest accuracy and the lowest loss. After running the grid search, we found that a batch size of 32 and a learning rate of 1e-5 provided the best results for our specific task of predicting sentiment scores and classifying marijuana users. To train our model, we chose to use the cross-entropy loss function, which is commonly used in classification tasks and measures the difference between the predicted probabilities and actual labels. Additionally, we utilized the Adam optimizer, which is an adaptive optimization algorithm that adjusts the learning rate based on the gradient magnitudes of the parameters.
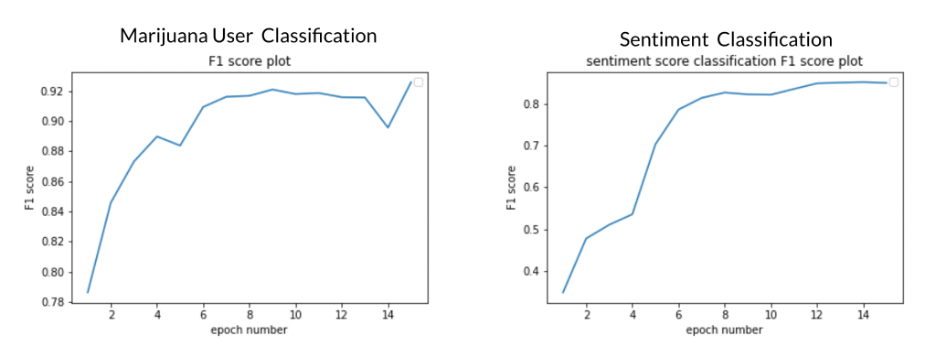
The pre-trained BERT model performed very well on both sentiment classification and marijuana user classification as shown in the figure below
Result
1.Average Sentiment Score Analysis
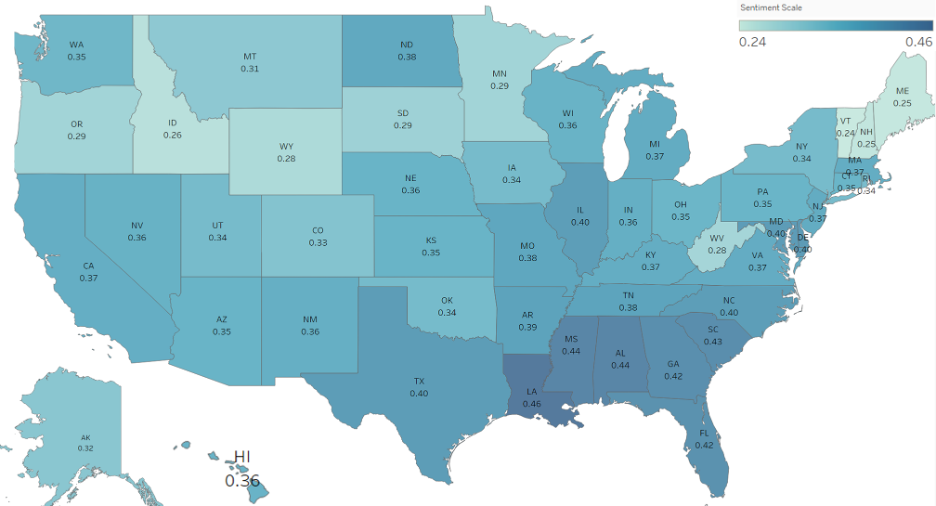
The figure above shows the sentiment data for marijuana users in different states. There are interesting patterns we found in terms of the attitudes towards marijuana. States like Louisiana (0.4649), Mississippi (0.4404), and South Carolina (0.4262) have the most positive attitudes towards marijuana, while states like Idaho (0.2607), Vermont (0.2424), and Maine (0.2475) have the most negative attitudes towards it.
It’s also worth noting that some states with legalized recreational marijuana, such as Colorado (0.3255) and Washington (0.3475), do not have as positive attitudes towards marijuana as some states where it’s still illegal, such as Louisiana and Mississippi. This could suggest that legalization may not necessarily lead to a more positive attitude towards marijuana.
In terms of geographical patterns, states in the South and Midwest tend to have more positive attitudes towards marijuana, while states in the Northeast and West tend to have more negative attitudes. However, this is not a general rule, and there are outliers that do not follow this pattern.
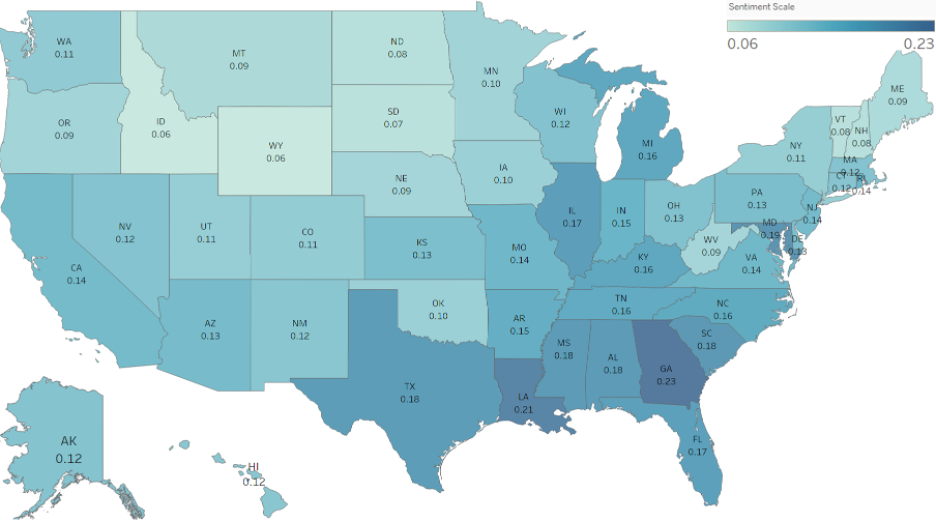
Based on the sentiment scores for all twitter users we captured, as shown in the figure above, it appears that overall sentiment towards marijuana is positive, with an average sentiment score of 0.136. However, there are variations in sentiment scores across different states.
The states with the highest average sentiment scores are Georgia (0.229), Louisiana (0.212), South Carolina (0.184), Mississippi (0.182), and Texas (0.179). These states have sentiment scores that are higher than the overall average and suggest a more positive attitude towards marijuana among twitter users in these regions. On the other hand, states with the lowest average sentiment scores are Wyoming (0.062), North Dakota (0.077), Vermont (0.076), and Maine (0.086). These states have sentiment scores that are lower than the overall average and suggest a less positive attitude towards marijuana among twitter users in these regions.
Overall, the sentiment scores suggest that there is a generally positive attitude towards marijuana among twitter users, but this attitude varies across different states. The sentiment scores can provide insights for policymakers and researchers interested in understanding public opinion towards marijuana and developing targeted strategies to address concerns and improve public attitudes.
2. Topic modeling
Analyzing the topics of tweets with positive, negative, or neutral attitudes is crucial. To uncover the topics in our tweet dataset, we employed the Latent Dirichlet Allocation (LDA) model to identify the topics of tweets falling into each sentiment category. The LDA model characterizes each topic by a distribution of words, indicating the likelihood of that topic including those words. Through the LDA model, we can generate word clusters that consist of keywords sharing commonalities, which can aid us in summarizing the topics represented by those clusters of words.
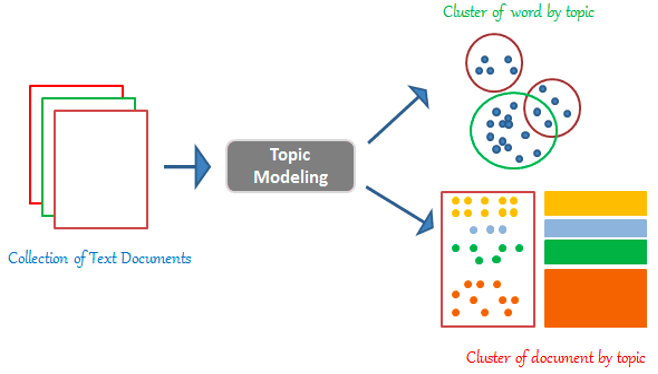
After examining the LDA model’s output, we opted to establish 3 separate topic groups due to the minimal amount of topic overlaps between them. Additional information about the topic modeling can be found in table below. The table indicates that the overall tweets focus on three primary topics: “sharing experiences of using marijuana”, “health implications of marijuana”, and “government policies relating to marijuana”.
3.Marijuana Users Demographic analysis
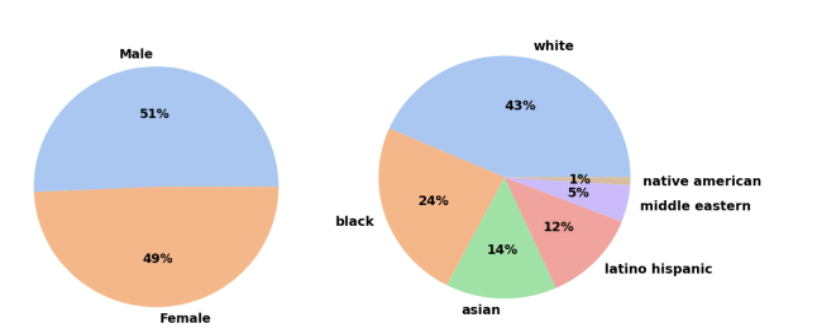
To determine the race, age, and sex of Twitter users who are flagged as marijuana users, we utilized a facial image recognition algorithm called Deep Face on a sample target of user profile pictures. Our goal was to achieve as accurate identification as possible. Our results can be summarized in the following three charts.
From figure below we conclude the gender distribution of our sample is almost equal, with males comprising 51% of the sample and females 49%. When examining race, we found that most users in our sample were white; however, the percentage falls short of the US percentage of non-Hispanic whites, which make up approximately 58% of the total population. Interestingly, we found that minority races were overrepresented in our sample compared to the US census of 2020.
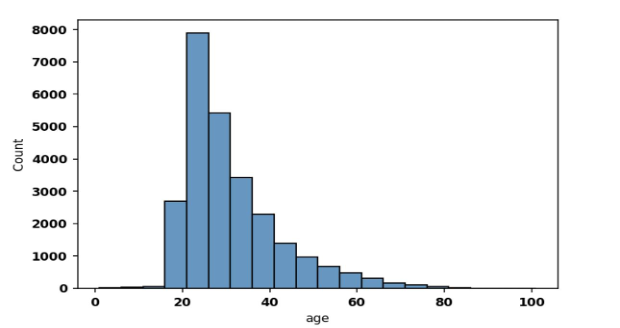
Regarding age, we observed from figure below that the age of marijuana users tends to concentrate between 15 to 20 years old and peaks between 20 and 25 years old, with declining concentrations thereafter. However, we did find some outliers who appear to use marijuana from a dangerously young age, between 0 to 15 years old. Overall, our results provide valuable insights into the demographic characteristics of Twitter users who are flagged as marijuana users.
Conclusion and Future Work
Our project aimed to analyze sentiment towards marijuana among Twitter users. We used data preprocessing and feature engineering to obtain a smaller dataset and hand-labeled a subset of 5000 tweets to determine sentiment scores and marijuana user classification. We employed traditional and deep learning models, such as random forest and BERT, to classify sentiment scores and users. We also used LDA to identify topics within tweets and the Deep Face algorithm to extract demographic information about users from their profile pictures.
While we made progress, we recognize areas for improvement. We were unable to perform BERT topic modeling due to time constraints, and in future work, we plan to explore new algorithms for topic modeling and label more tweets to train more robust deep learning models. Additionally, we acknowledge the importance of investigating the health effects of marijuana use and intend to focus on this topic in future work utilizing topic modeling to gain a more comprehensive understanding of public and medical perspectives.
Acknowledgement
We thanked Professor Anand, Professor Caliskan and Dr. Xie for sponsoring and supporting us to finish this project.
Reference
1. Devlin, Jacob, et al. “Bert: Pre-training of deep bidirectional transformers for language understanding.” arXiv preprint arXiv:1810.04805 (2018).
2. Blei, David M., Andrew Y. Ng, and Michael I. Jordan. “Latent dirichlet allocation.” Journal of machine Learning research 3.Jan (2003): 993-1022.
3. McHugh, Mary L. “Interrater reliability: the kappa statistic.” Biochemia medica 22.3 (2012): 276-282.
4.Taigman, Yaniv, et al. “Deepface: Closing the gap to human-level performance in face verification.” Proceedings of the IEEE conference on computer vision and pattern recognition. 2014.