Team Members


Abstract
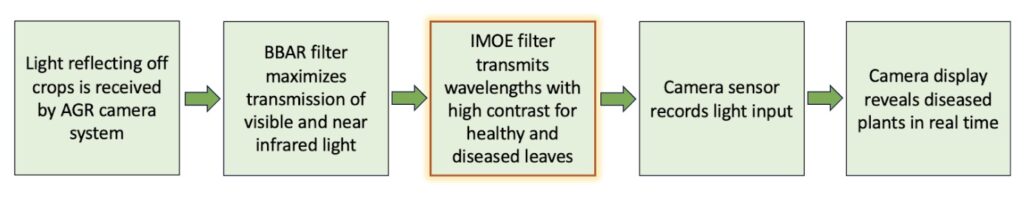
AGR’s vision is to enhance its handheld spectrometer system by introducing two specialized optical coatings. The first coating, a broadband anti-reflection (BBAR) layer, is designed to maximize visible and near-infrared transmission. The second coating, an imaging multivariate optical element (IMOE), precisely corrects incident NIR spectra to amplify contrast between diseased and healthy plants. Both coatings, developed using realistic optical constants from materials synthesized in the URNano cleanroom and designed in OptiLayer, contribute to AGR’s goal of minimizing the need for software-based image analysis in detecting crop affliction and preventing disease spread. The characterization of material and optical properties will be conducted on multiple spectrometer devices post data collection.
System Block Diagram
Method and Material Characterization
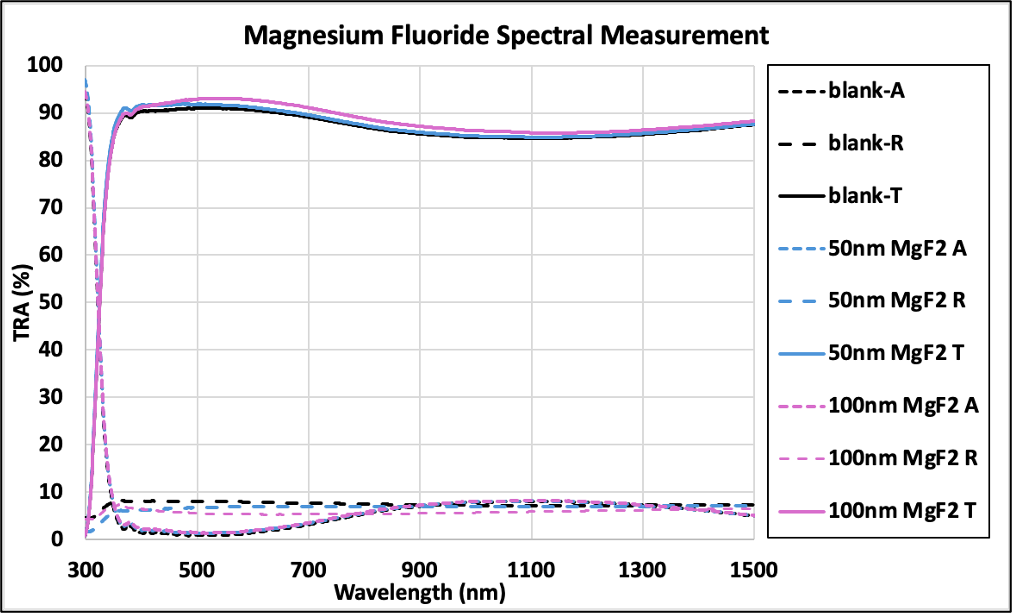
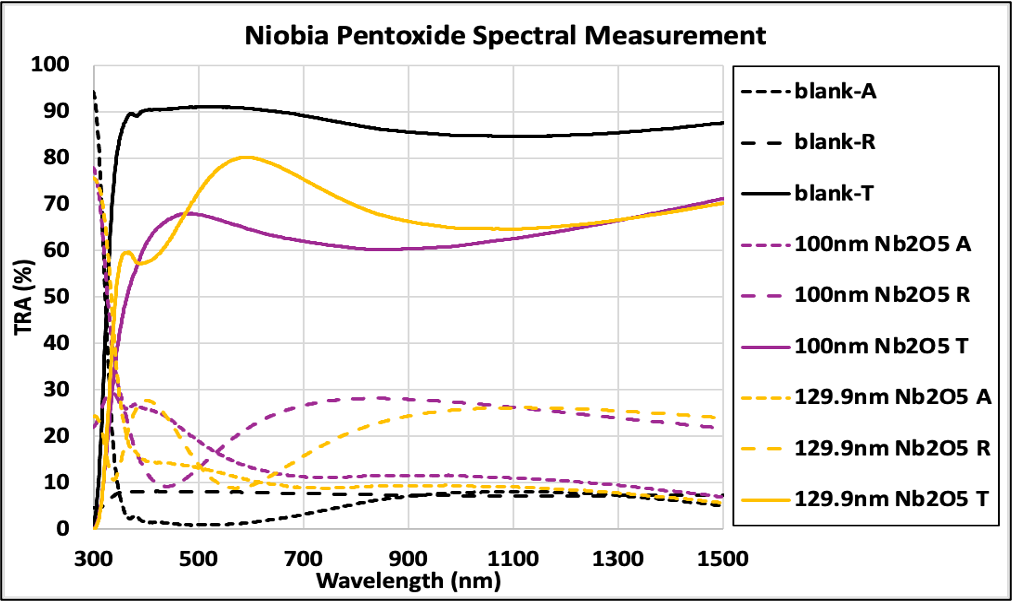
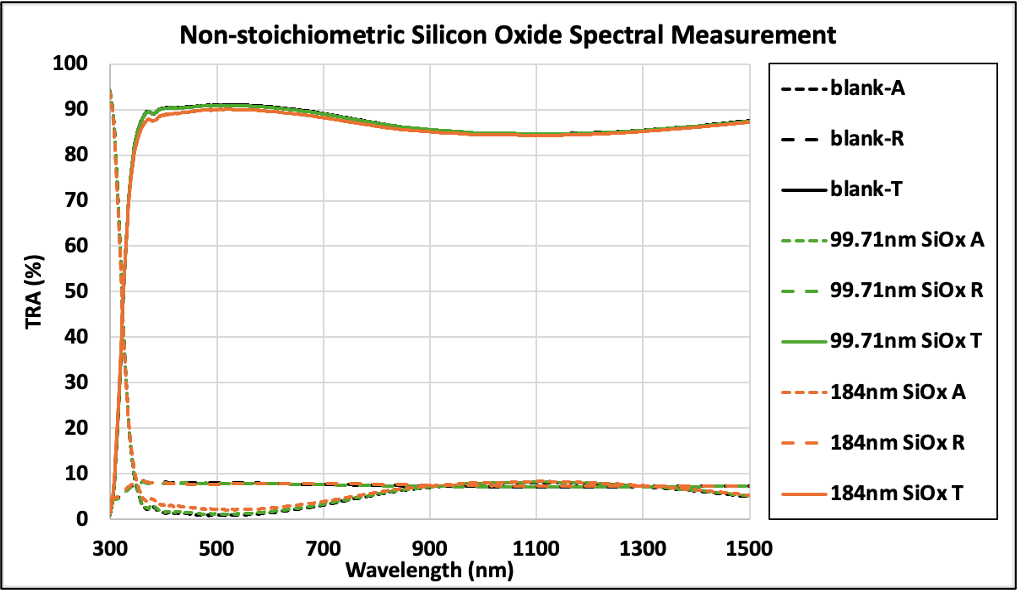
Physical Vapor Deposition, PVD, is commonly used for fabrication of optical interference coatings for its high reproducibility, nanometer-scale deposition capabilities, and versatility of material and process parameters. Each layer material was characterized using thermal evaporation in the UR Nano Kurt J Lesker box coater to more realistically design the BBAR and IMOE filters. A Filmetrics spectrophotometer was used to measure optical performance. OptiCHAR was used to recover the refractive index and extinction coefficient (n and k) for each material.
Imaging Multi-Variate Optical Filter
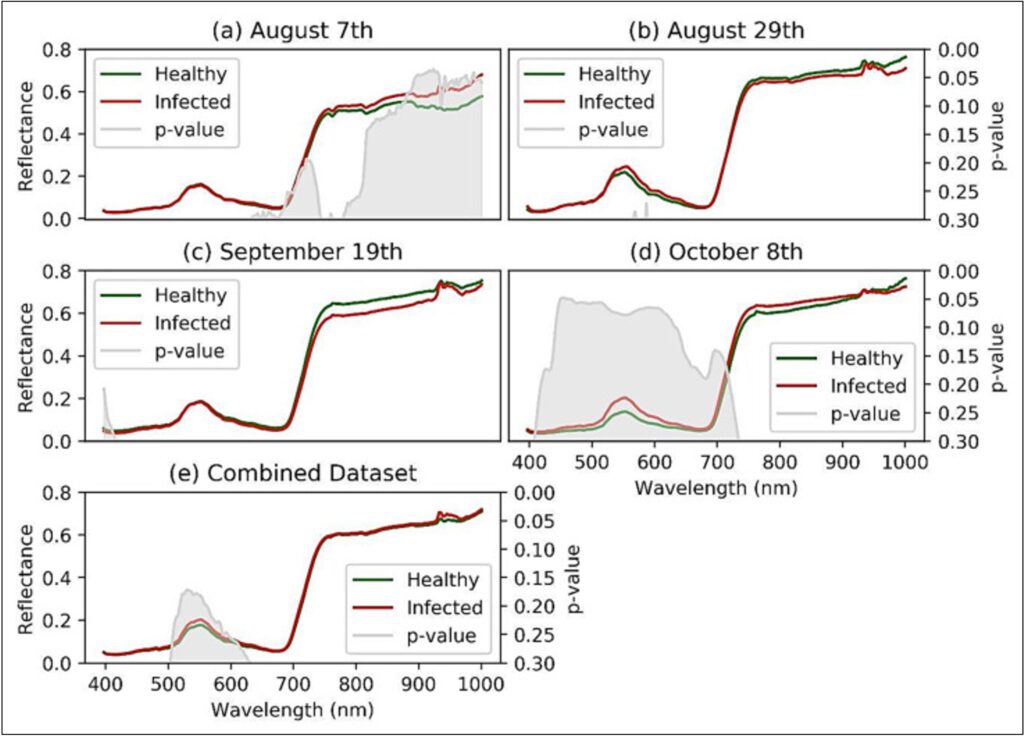
Notably, the visible and near-infrared wavelength ranges exhibited differences between healthy and infected vines. This study proves through the comparison of classification methods, including VI based, pixel-based, and image-based approaches, that the best way to accurately classify infected vines is through machine learning.
The figure on the left shows the reflectance spectra signature discrimination for healthy and GVCV-infected vines at the early infection stages. U.S. National Library of Medicine
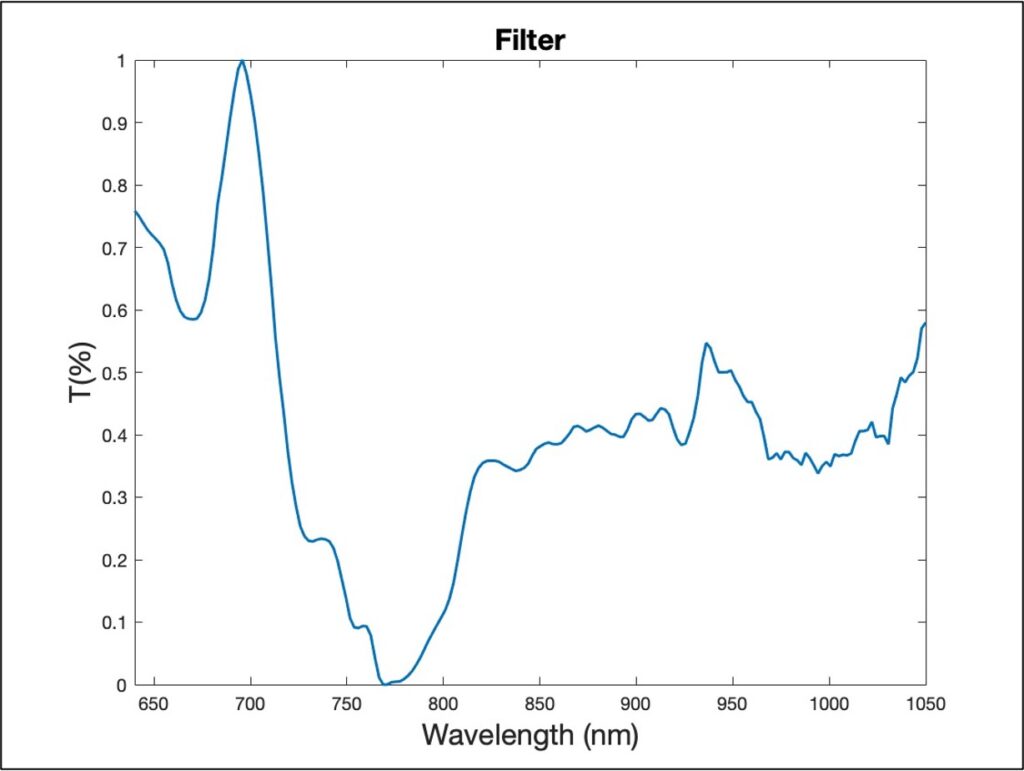
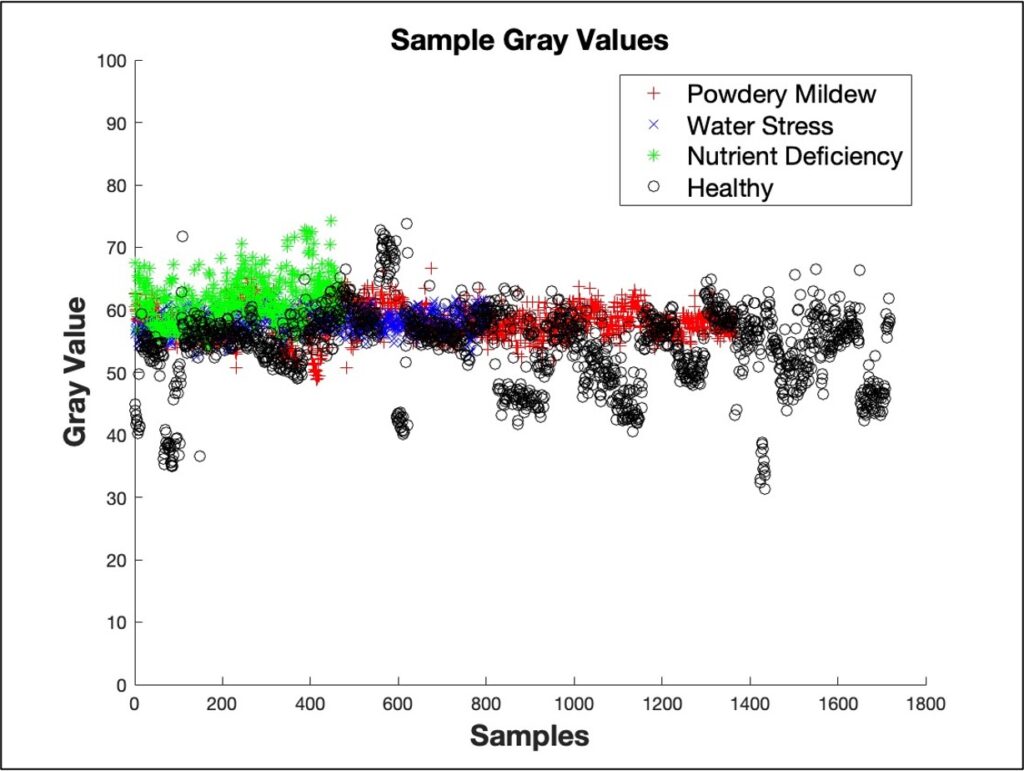
Spectrometer data for over 1000 healthy and diseased samples was provided by the customer. Principal component analysis (PCA) was used to determine which wavelengths show the highest contrast between different disease populations. The relative variance at each wavelength was then used to create transmission targets for the IMOE filter. Wavelengths with variance under a predetermined threshold were set to 0% transmission targets. The final filter was applied to each original sample spectrum and then integrated to simulate the grayscale value which would be received by the IR pixel.
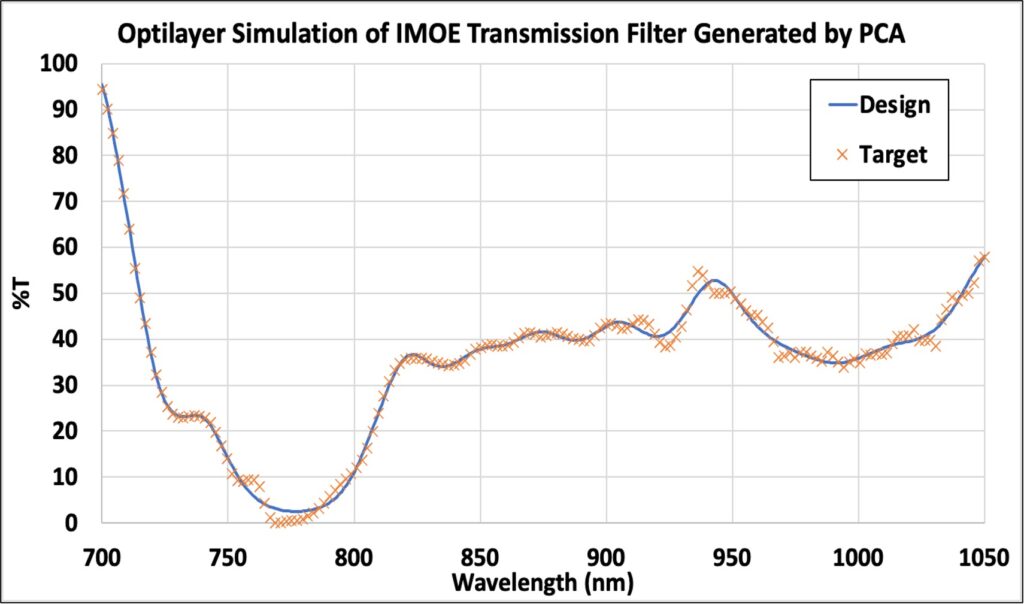
After performing PCA analysis, Optilayer was used to design an IMOE filter. This shows the customer the feasibility of a filter matching the spectral data from the grapevines. The design consists of 46 layers of alternating Niobium Oxide and Silicon Dioxide (both characterized in UR Nano).
Photon Management
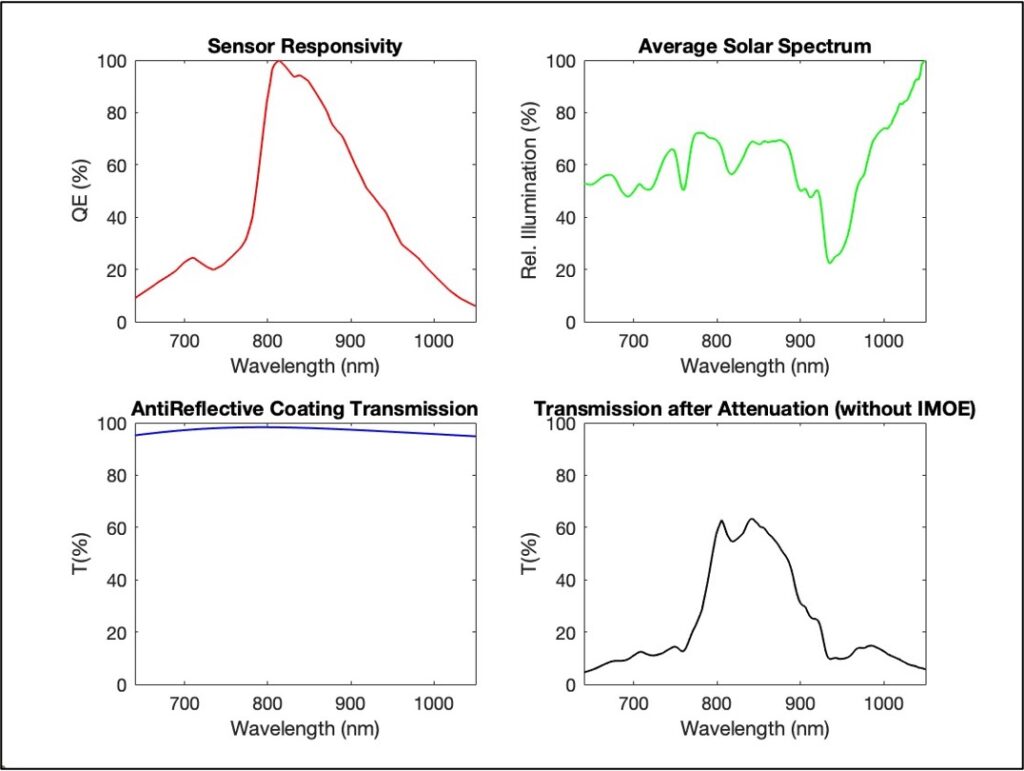
Sources of signal attenuation limit the overall transmission and contrast between samples. Quantum efficiency and the solar spectrum dictate the intensity at each wavelength. A BBAR coating was designed in Optilayer using the recovered optical constants. The design is 7 layers and has been optimized for >95% transmission over the detection range.
Meniscus Lens Systems
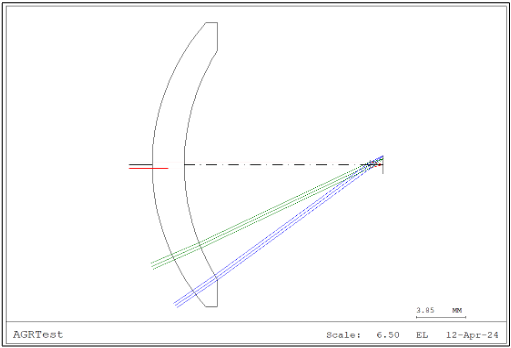
Using the specifications of the provided camera, a simulation using CodeV was designed. The wavelength that was optimized over was 600-1100 nm with a center wavelength of 850 nm. A half FOV of 35 degrees. To optimize, the distance between the optical dome and the first surface of the provided imaging system was varied while trying to maintain a zero angle of incidence on the front face of the optical dome.
Conclusions and Future Work
The exploration of custom meniscus components suggests that the cost is too high when compared to the benefits it provides to the system. Based on the spectral data provided by the customer, the contrast between populations is insufficient to accurately identify the presence of specific disease. By integrating over camera pixels, there is less data available to distinguish between samples. PCA suggests the contrast filter approach is unable to identify whether a sample has anydisease at all. In the future, AGR will investigate spectral signals from different plants and disease populations. The MATLAB simulations created can be used to design the contrast filter targets for any future dataset.
Acknowledgements and References
We are incredibly grateful for the guidance of our advisor Dr. Jennifer Kruschwitz, the support of our project stakeholder Francis Pellegrino and the feedback from Dr. Wayne Knox.
Nguyen, Canh, et al. “Early Detection of Plant Viral Disease Using Hyperspectral Imaging and Deep Learning.” Sensors (Basel, Switzerland), U.S. National Library of Medicine, 22 Jan. 2021, www.ncbi.nlm.nih.gov/pmc/articles/PMC7866105/.
Fiola, J. (2021). Drought Stress, Vine Performance, and Grape Quality. University of Maryland Extension.
Roelofsen, Hans D, et al. “Predicting Leaf Traits of Herbaceous Species from Their Spectral Characteristics.” WILEY Online Library, Ecology and Evolution, 14 Feb. 2014, onlinelibrary.wiley.com/doi/10.1002/ece3.932.