Sulfite Sensor Results
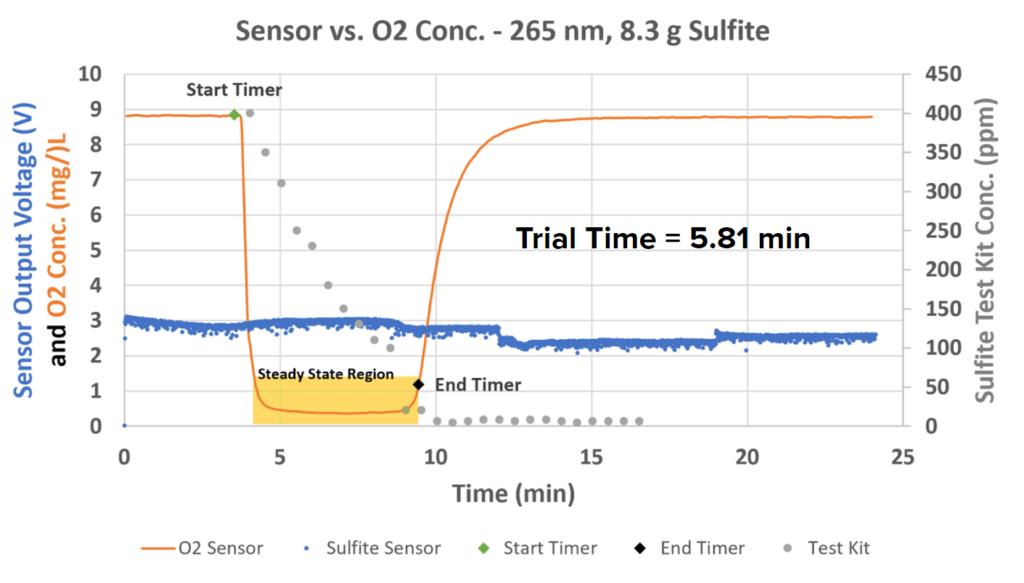
The data above shows that the sensor was at least able to detect a change in the sulfite concentration as the reaction went on. There were two major dips in the sulfite concentration during the reaction. This is indicative of a two-step reaction: one step where O2 is consumed, and another where the intermediate creates sulfate:
Step 1: SO32-+O2 → SO52- (fast) (Equation 4)
Step 2: SO52-+Na2SO3– → Na2SO4 (slow) (Equation 5)
The timer was stopped approximately when the second sulfite dip levels off. Further testing has shown that in the presence of PEG, there is only one dip that remains low for the course of the reaction:

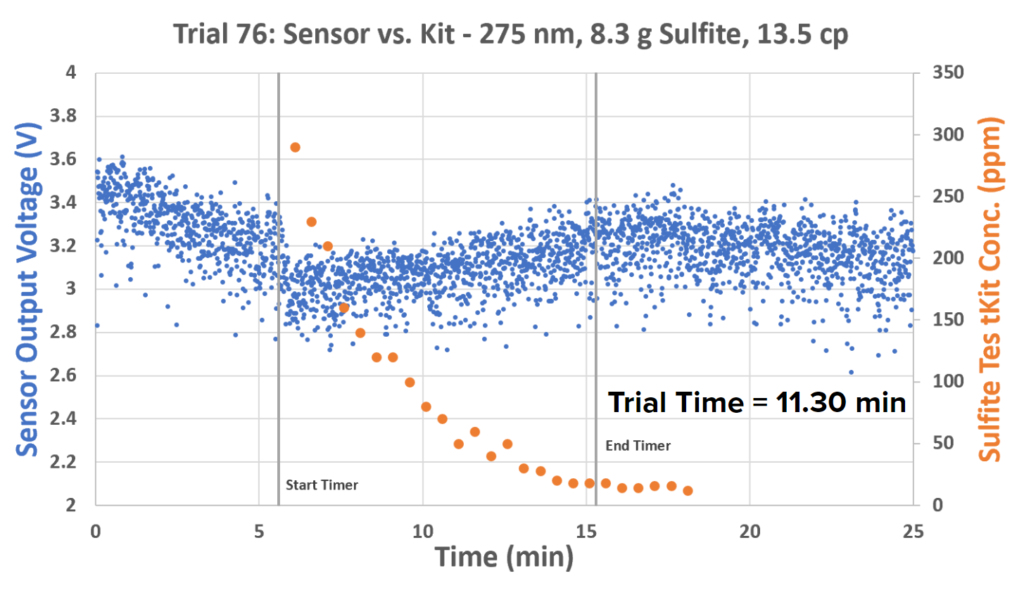
Both the slopes changing of the sulfite test kit data and the shape of the sulfite sensor curves suggest that more complex chemistry is occurring here than originally hypothesized. The difference in sensor shapes when PEG is and is not present is indicative that there may be a UV-absorbative intermediate that results when PEG is present.
It is also worth noting that as the viscosity increased, the reaction time also increased. Student’s t-tests between the water OTR with the 10 cp OTR and the 13.5 cp OTR yielded p-values of 0.03 and 0.009, respectively. This shows that the OTRs of viscous fluids are significantly different than with water. Smaller bubbles were observed during higher viscosity trials and the surface tension was calculated and determined to be lower than water without PEG. Further testing and bubble radius calculations are recommended to better characterize the effect PEG has on this reaction.