Authors
- Heon-Seung Lee
- Yiwen Sun
- Autumn Yhu
Mentor
Prof. Mark Juba
Sponsor
Dr. Brian Cleary
Abstract
The objective of this project is to develop a continuous system for producing high-value p-toluidine. This system utilizes a nitroarene reduction reaction conducted under different conditions to optimize the process and achieve a desired product yield of 95%.
Introduction
The organic synthesis of p-toluidine holds many applications, including but not limited to making additives, dyes, pigments, and polymer components (Romero).
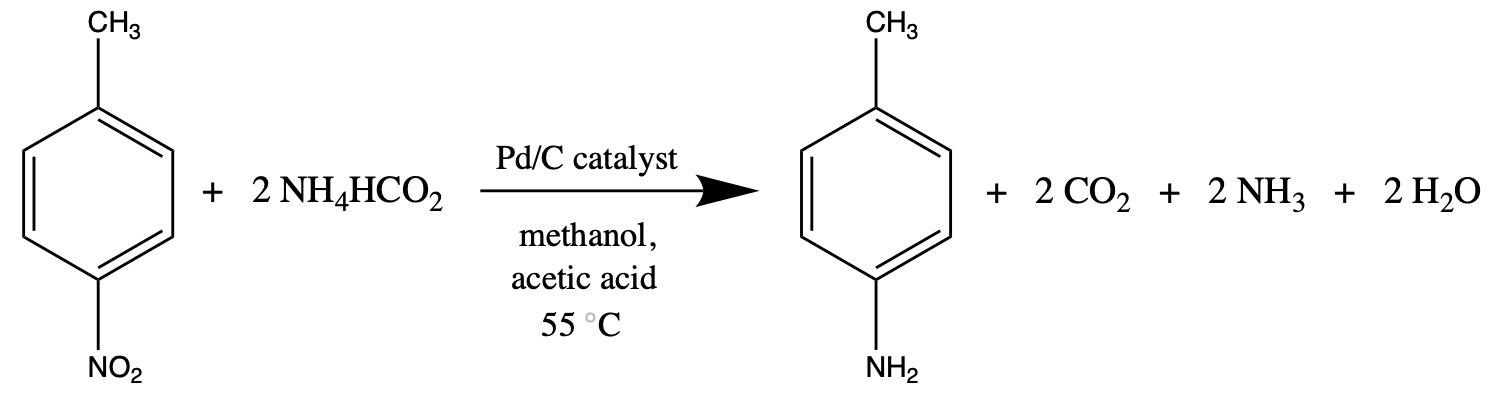
As pictured in Figure 1, the reaction used in this project involves the interaction of p-nitrotoluene and ammonium formate dissolved in methanol to produce p-toluidine and other gaseous byproducts. This process is facilitated by a 1% Pd/C catalyst, which promotes hydrogen transfer from the ammonium formate and an acetic acid additive.
The project comprises three major phases. The first involves comprehension of high-performance liquid chromatography (HPLC) techniques, primarily converting observed peak areas from the chromatograms into conversion data.
Next, a batch reactor setup is used to analyze the kinetics of the reaction and determine the rate equation. Experiments are conducted to determine the order of the reaction and most efficient conditions for achieving higher conversion.
Upon completion of the batch experiments, a continuous system can be constructed. This final phase focuses on investigating conditions that optimize the reaction and minimize mechanical/chemical issues, as it should reduce manual labor costs through feasibility.
Batch Reactor Work
PFD & Setup
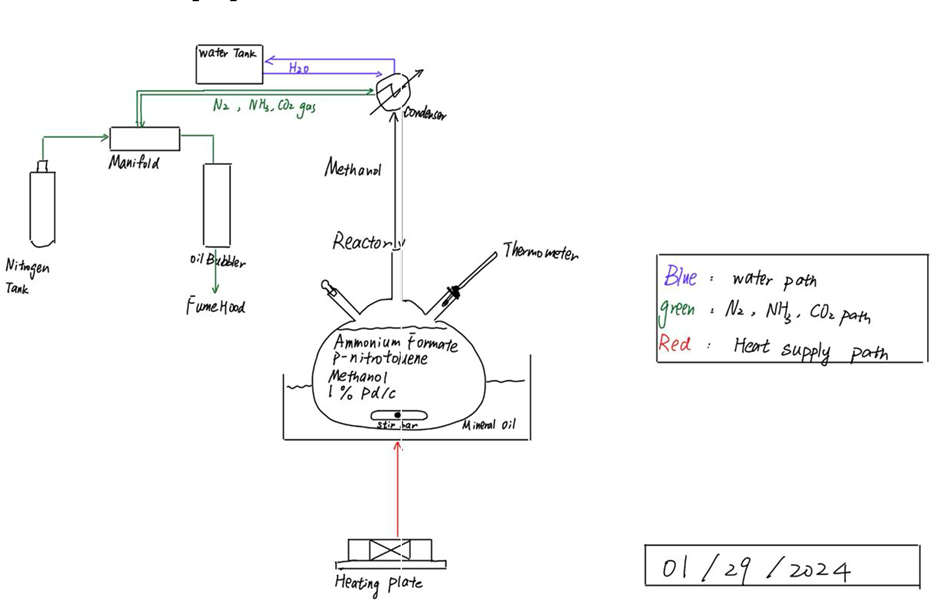
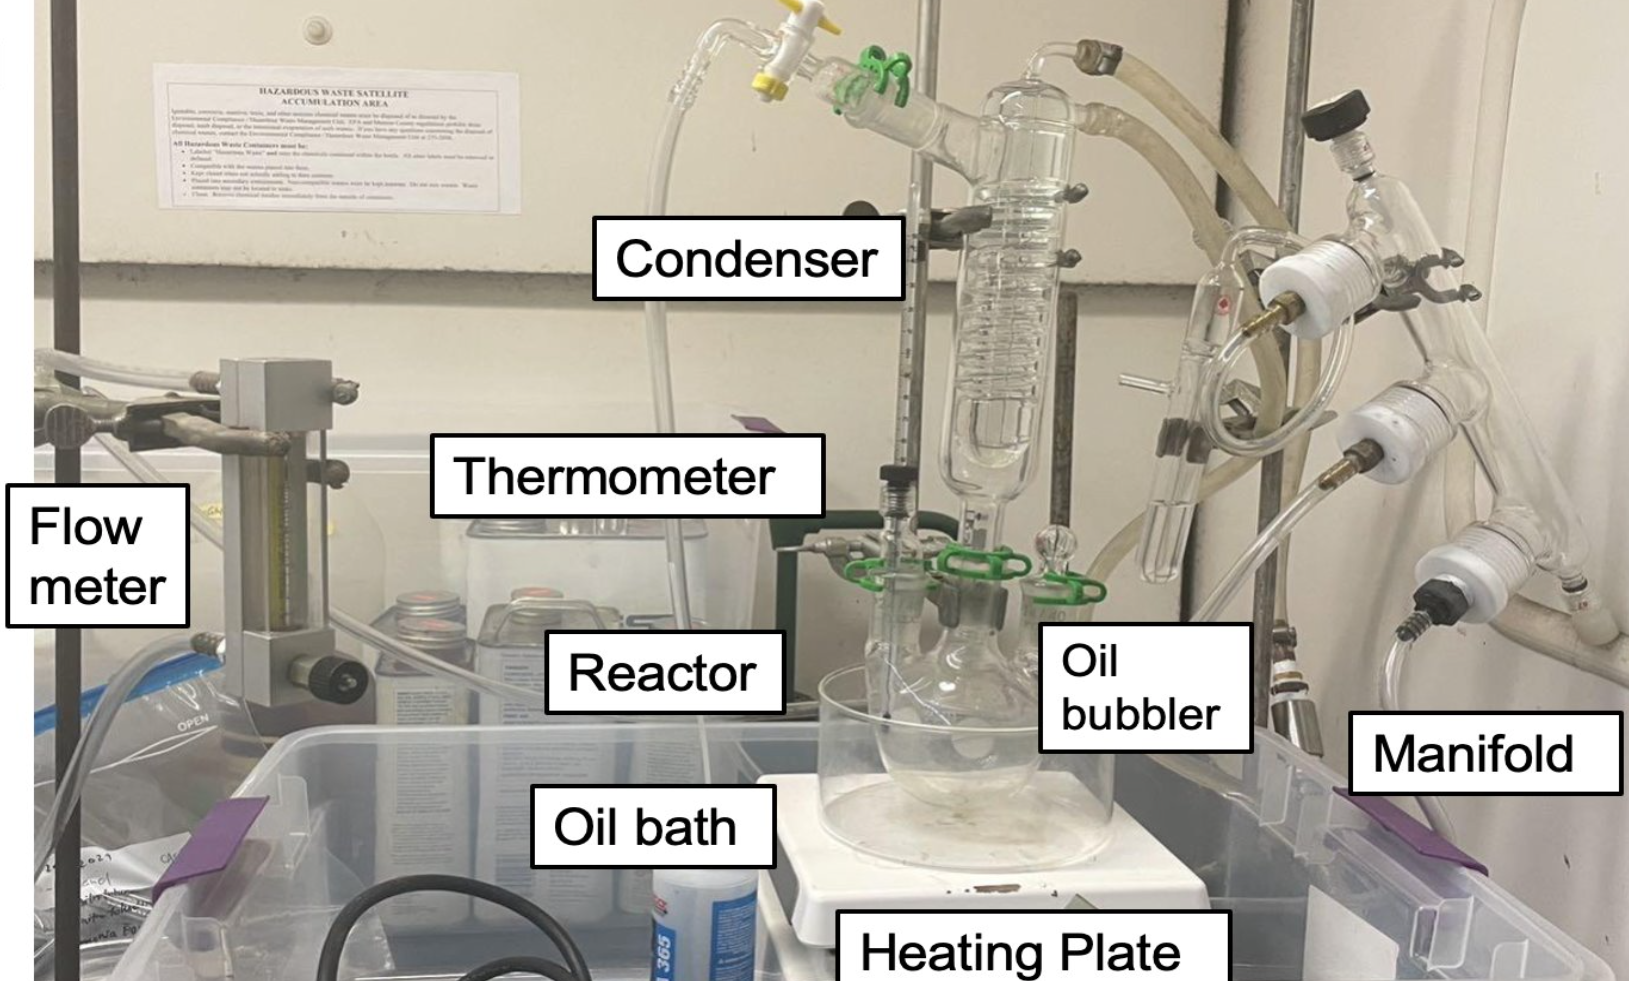
In order to understand the optimal conditions for the reaction, a batch system (Figures 2 & 3) was developed. A three-neck, 300-ml round flask was used as the reactor, which was situated in a mineral oil bath set on a heating plate. The temperature of the reactant solution (100 ml) inside the flask was maintained at 58 °C. To prevent any potential reactants becoming lost as vapor, a condenser was connected to the top of the reactor. A nitrogen tank and oil bubbler were also attached to a manifold to create an inert environment and monitor gas accumulation from the reaction.
Data Analysis Methods
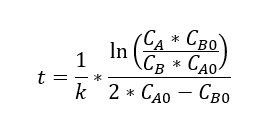
Three proposals were made for the kinetics of this reaction, which are represented by the following equations (t = residence time in the reactor, k = rate constant, x = conversion):
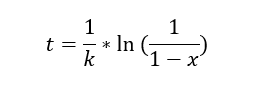
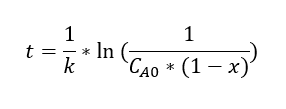
A line-fitting method was used to analyze the data with the equations.
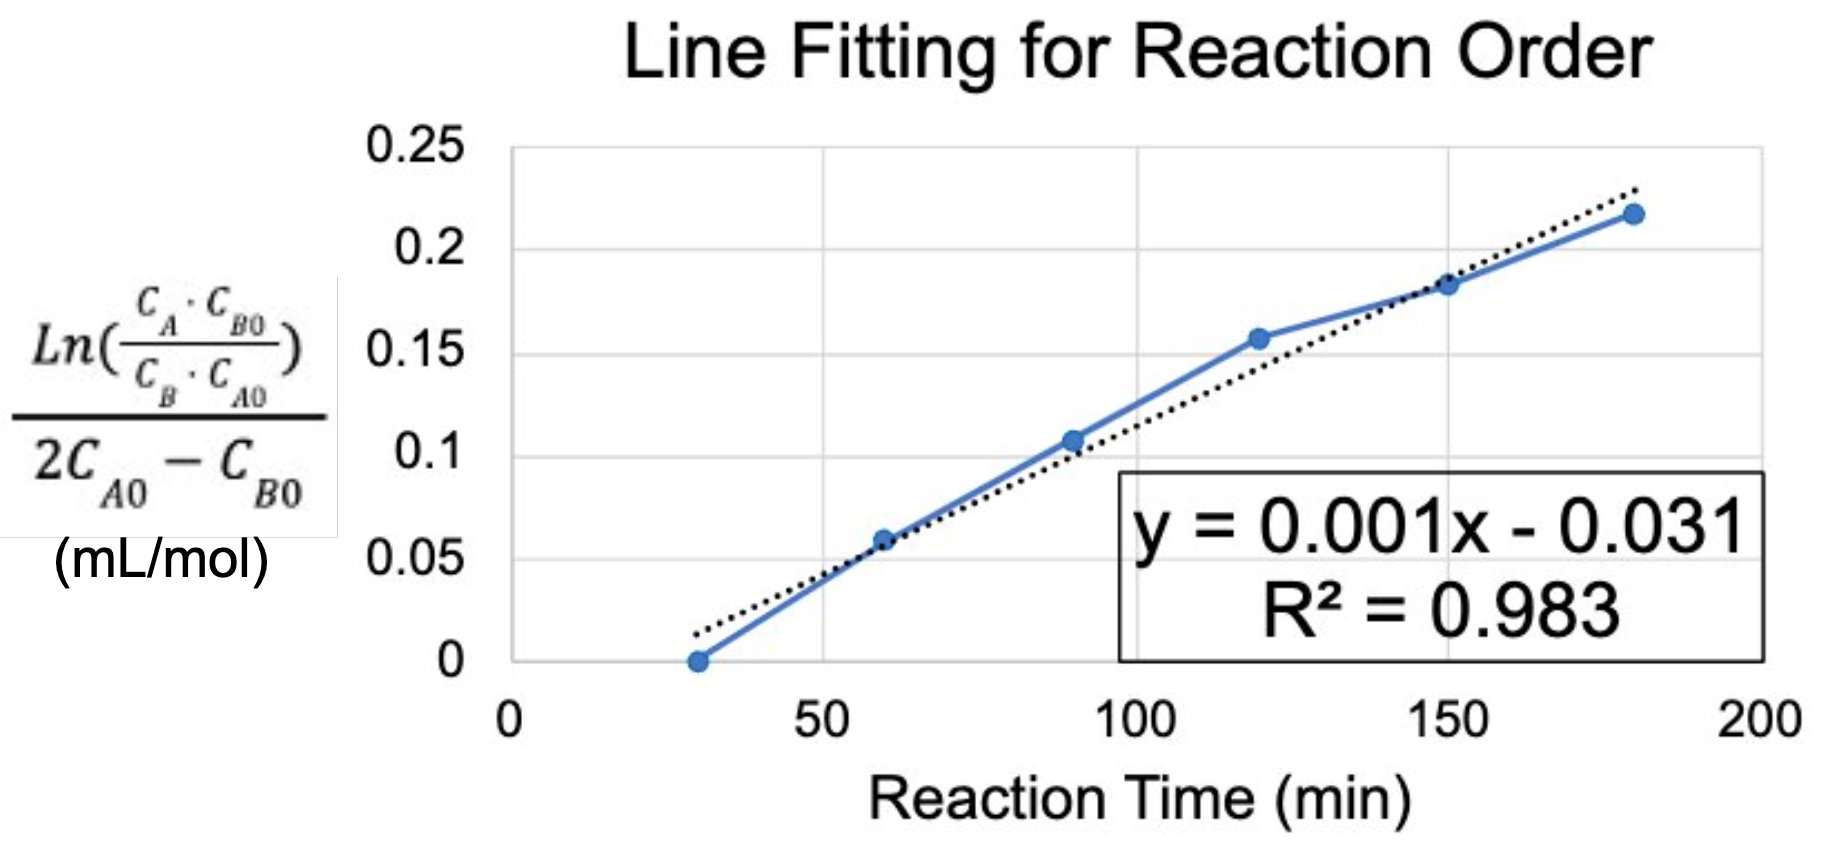
For each experiment, samples were taken at 30-min increments. Conversion was determined with HPLC, and the data points were plotted for linearity, which was then used to analyze the order of reaction. It was found that the reaction best exhibited behavior of Equation 3: 1st order for both p-nitrotoluene and ammonium formate.
Proton Concentration Effects
During this phase of the project, various reaction conditions were investigated; the first set of experiments involved analyzing different concentrations of the reaction’s proton donors, ammonium formate and acetic acid, and their effects on conversion. Seven experiments were derived from a 22 factorial design with three replicates of a center point (Table 1).
| Proton Donor | – | 0 | + |
| Ammonium Formate | 2 equiv | 3 equiv | 4 equiv |
| Acetic Acid | 2 equiv | 3 equiv | 4 equiv |
The temperatures of the condenser and hot plate were set at constant values throughout the trials. During the data analysis of the runs, it was observed that the conversion and rate constant increased from (2,2) to (3,3) to (4,4), where 68% and 1.35e-3 L/mol*s respectively were achieved. This indicates that increasing the amount of reactant materials raises the overall conversion.
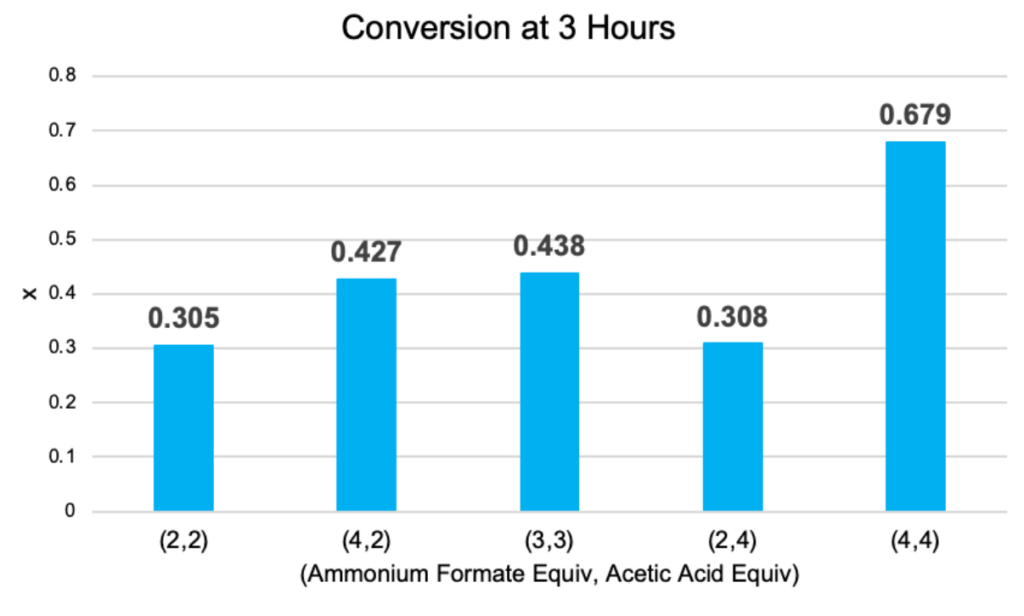
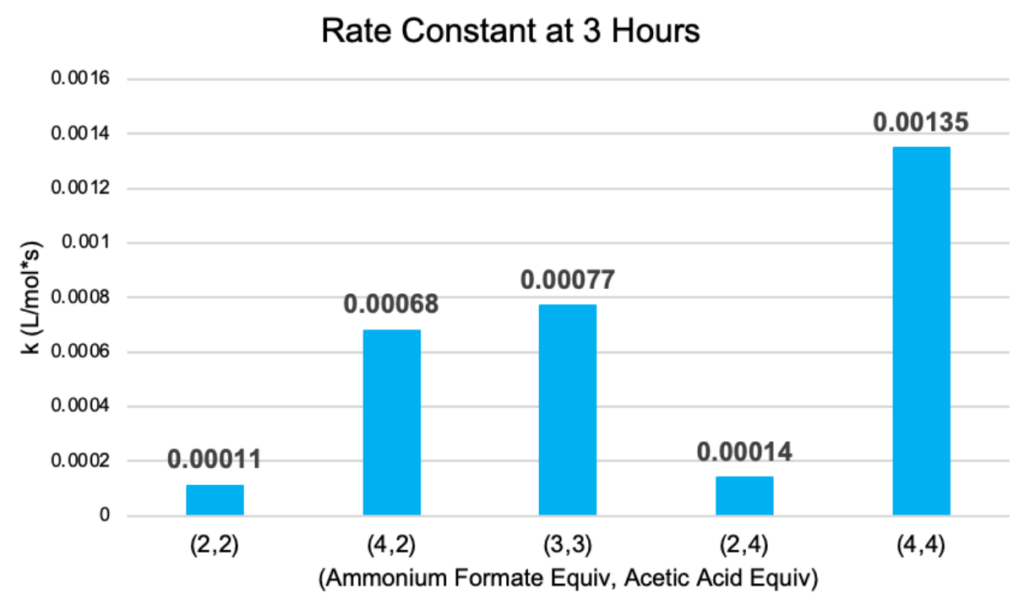
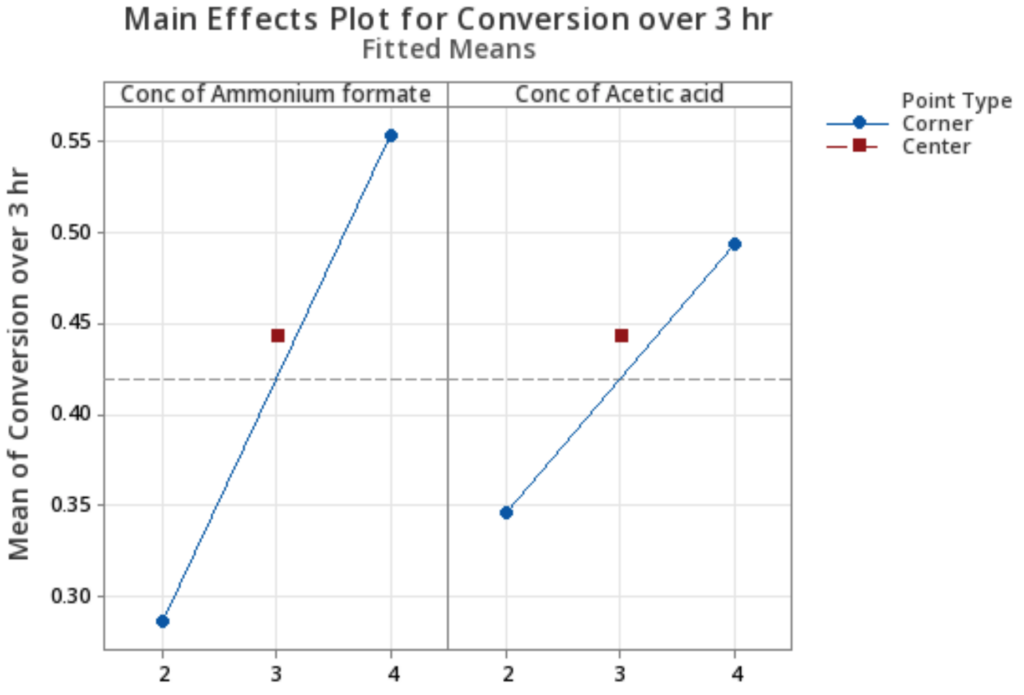
It was also found that conversions and rate constants from the (4,2) and (2,4) trials were notably different, with (4,2) producing higher values. The fitted mean graph in Figure 7 further demonstrates that while both proton donors positively impact the reaction, ammonium formate is more significant. Additionally, the vast difference in rate constants can be the result of pH changes from different ratios of ammonium formate and acetic acid.
Catalyst Concentration Effects
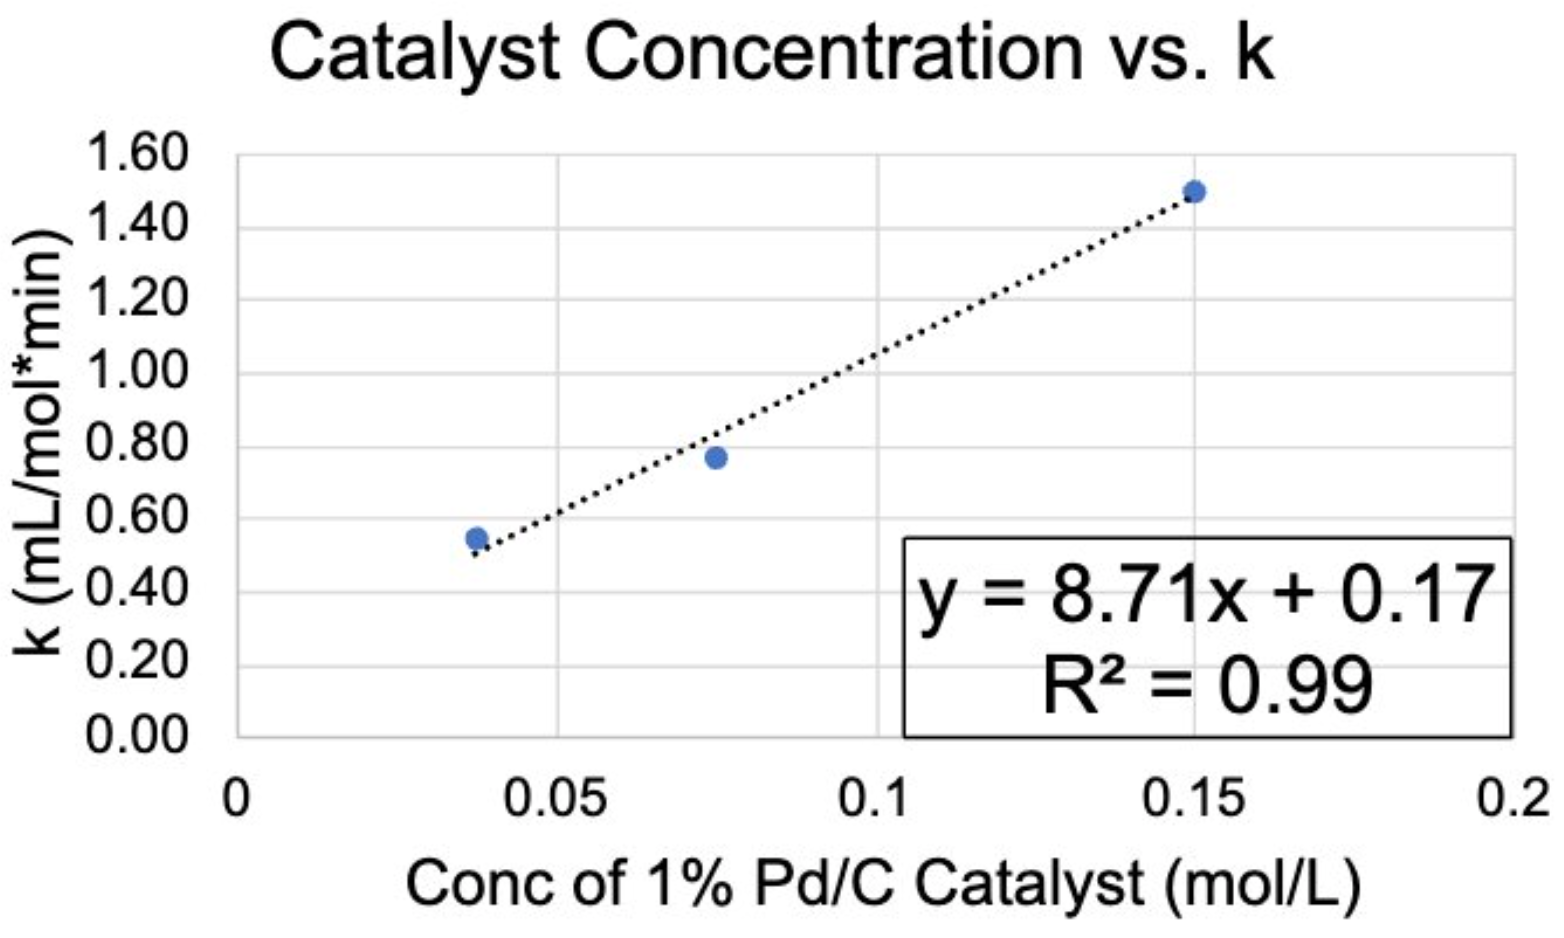
With these optimal conditions determined, an understanding of the catalyst was also necessary, as it was crucial part in the reaction’s overall progression. As such, experiments were performed, which involved varying the amount of catalyst as well as recycling catalyst to observe its life. Two more (3,3) trials were conducted, but the amount of catalyst was both doubled and halved. It was observed that a linear relationship existed between the concentration of catalyst and rate constant, drawing the conclusion that the conversion is proportional to the amount of catalyst.
Catalyst Activity
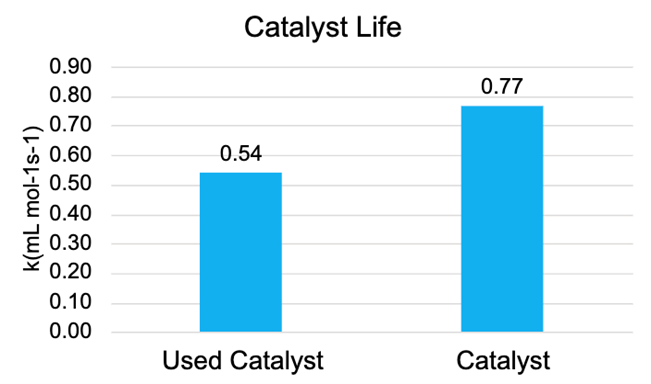
To test the recycled catalyst, another (3,3) experiment was conducted with fresh catalyst for 24 hours; the experiment was then repeated using this same catalyst. As shown in Figure 9, the rate constant dropped to about 70%, which indicates that the catalyst efficiency diminishes after 24 hours.
Continuous Reactor Work
PFD & Setup
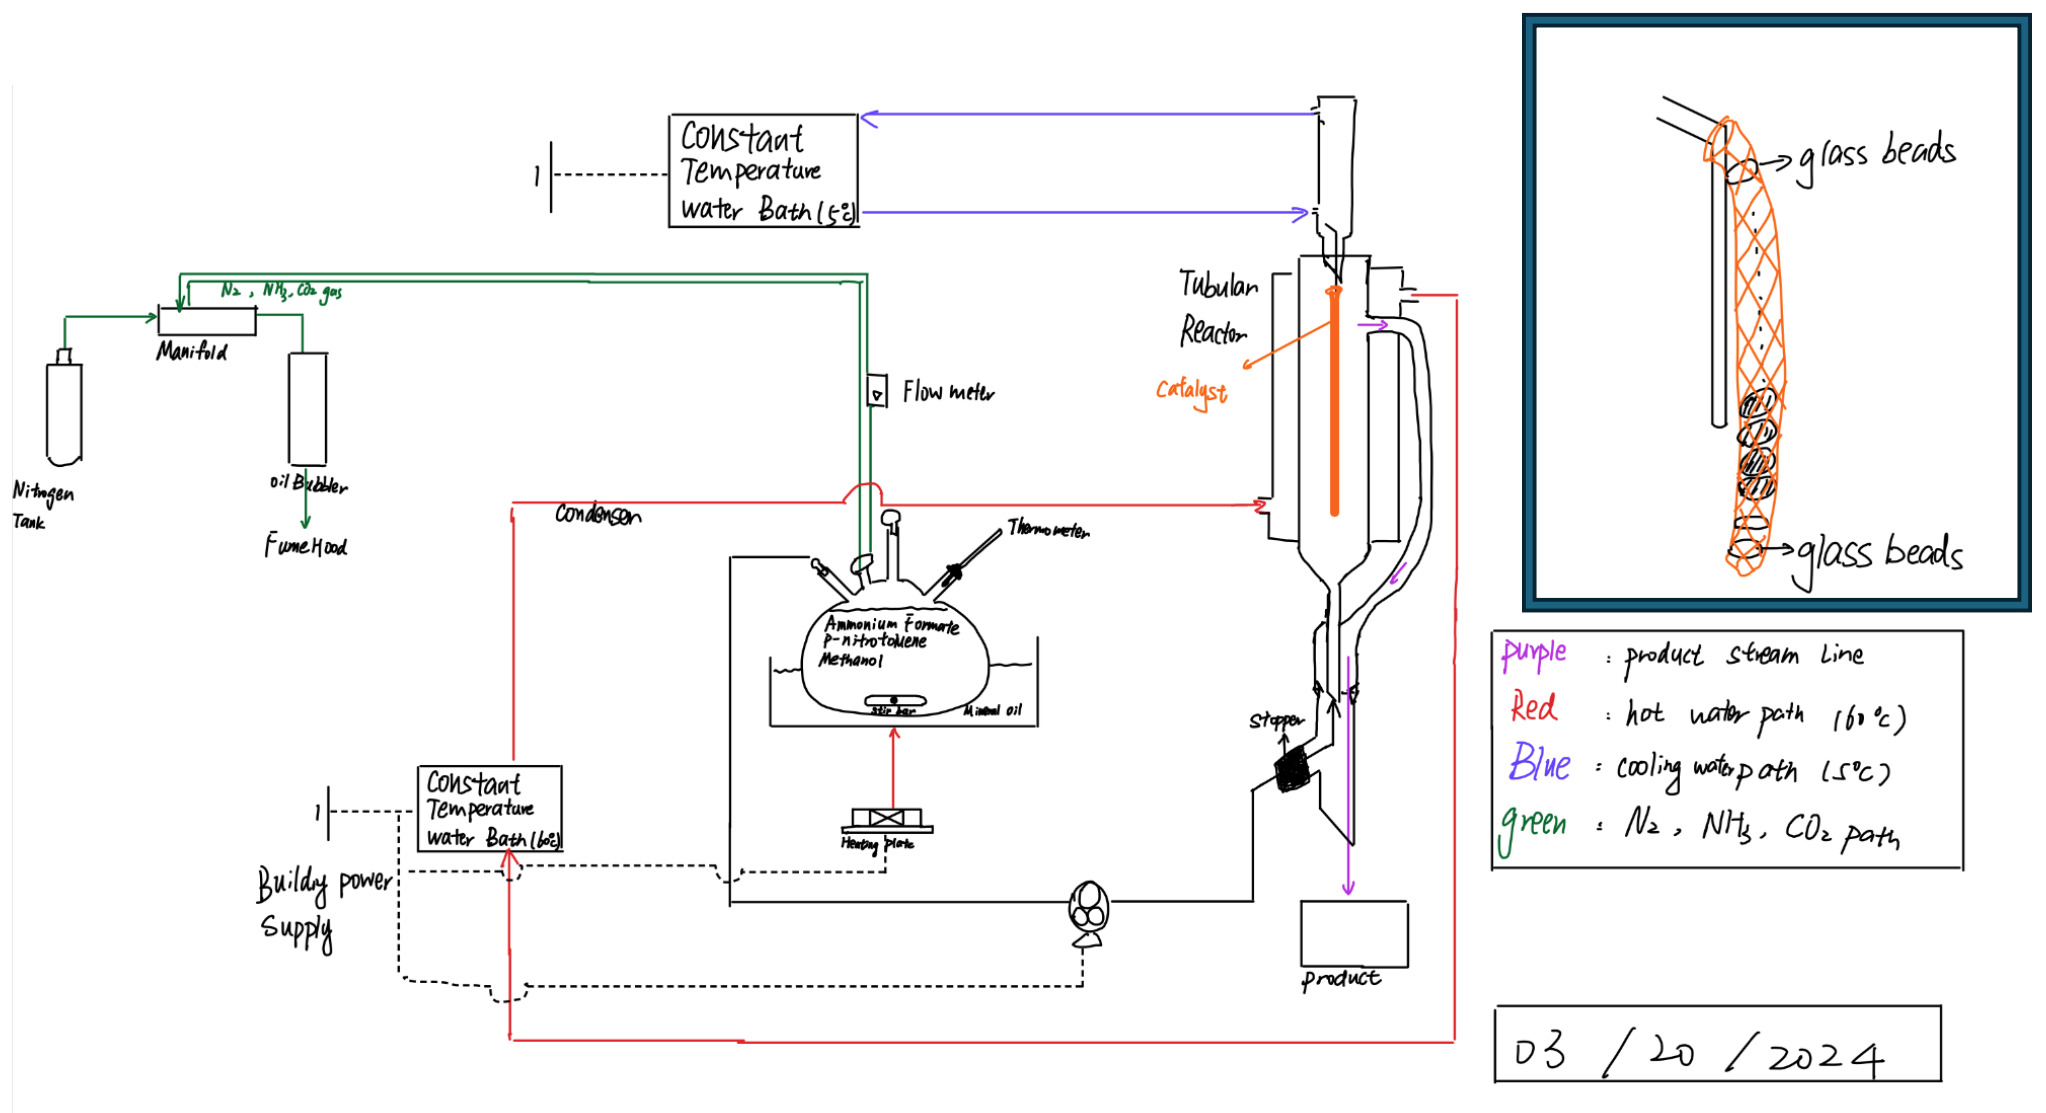
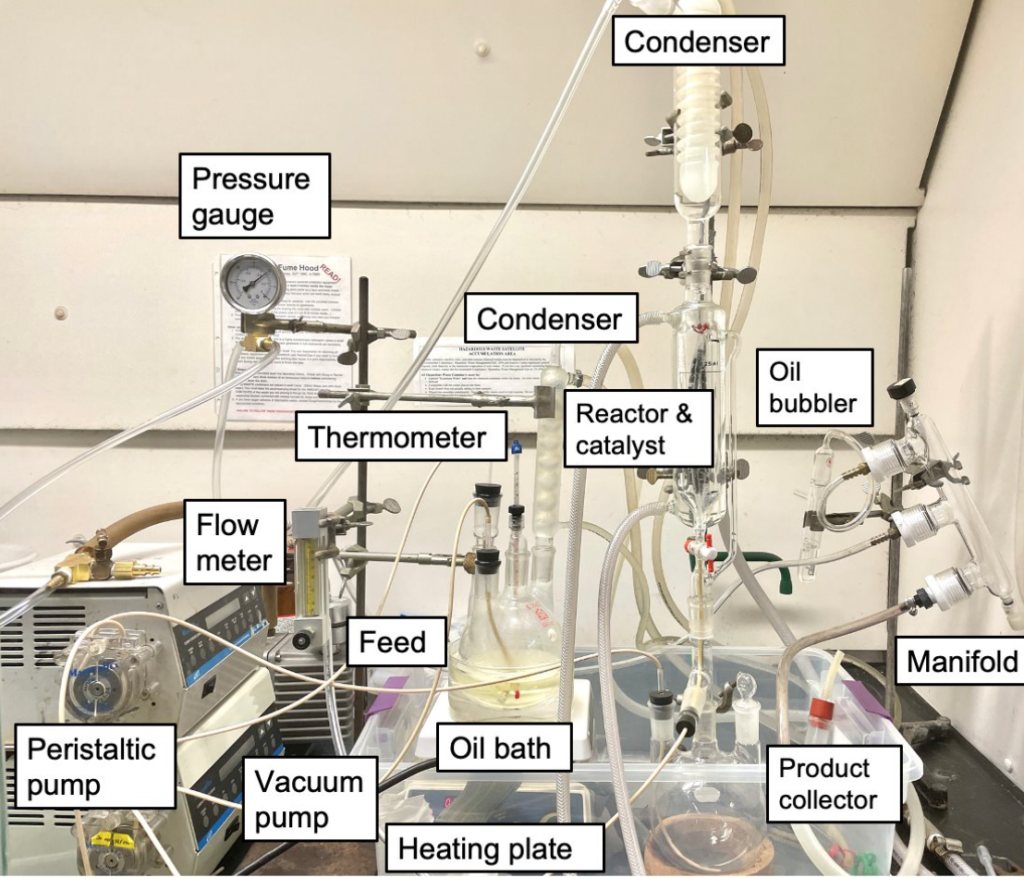
After completing experiments and finalizing findings for the batch phase, the continuous reactor was assembled (Figures 10 & 11). Similar to the batch setup, a nitrogen tank, oil bubbler, and manifold are utilized to maintain the inert environment during the reaction. The process starts from a feed flask, which contains the reactants dissolved in methanol and acetic acid; temperature and other conditions are maintained by a heating plate and condenser. The feed is transferred to a tubular vessel, which acts as the reactor, using a peristaltic pump system. In the reactor, the reactants interact with the catalyst as the fluid moves upward; the catalyst is situated by glass beads and mesh tubing. Once the solution reaches the top, it flows through an opening down to a product flask placed at the bottom of the setup.
Data Analysis Methods
For the continuous phase, the conversion can be calculated using the following equation:
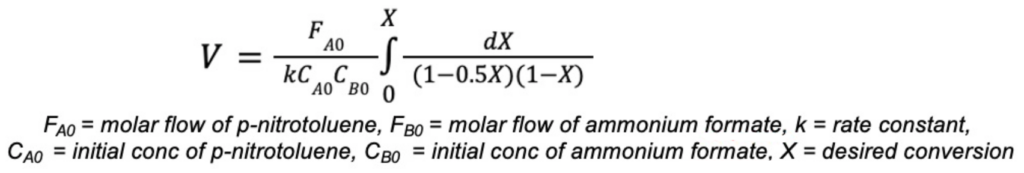
Experimental Work
In the first continuous experiment, the peristaltic pump flow was set at 0.5 ml/min. p-nitrotoluene, ammonium formate, and acetic acid are used in a ratio of 1:4:4 equiv. A single mesh sleeve of catalyst (about 0.1 equiv or 1.11 g) was added to the reactor.
During the run, bubbles accumulated on the sleeve, causing mass transfer limitations that interfered with interactions between the reactants and catalyst. In addition, little to no indicators of the reaction progression were seen, notably the color change observed during the batch trials. As such, subsequent experiments focused on testing solutions for the mass transfer issues, as well as methods to promote the reaction and continuous behavior (Table 2).
| Experiment | Modification |
| 2 | Vacuum Pump |
| 3 | Vacuum Pump + Motor |
| 4 | Vacuum Pump + Feed Recirculation |
| 5 | Vacuum Pump + Recycled Catalyst |
| 6 | Vacuum Pump + Motor |
| 7 | N/A (N2 Purging) |
Results & Discussion
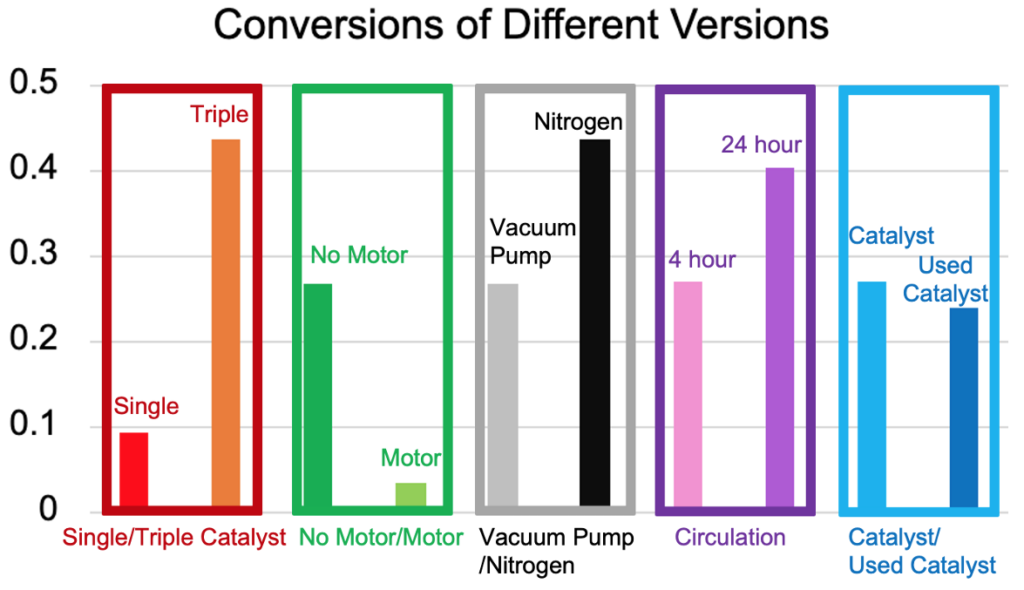
The results are displayed below:
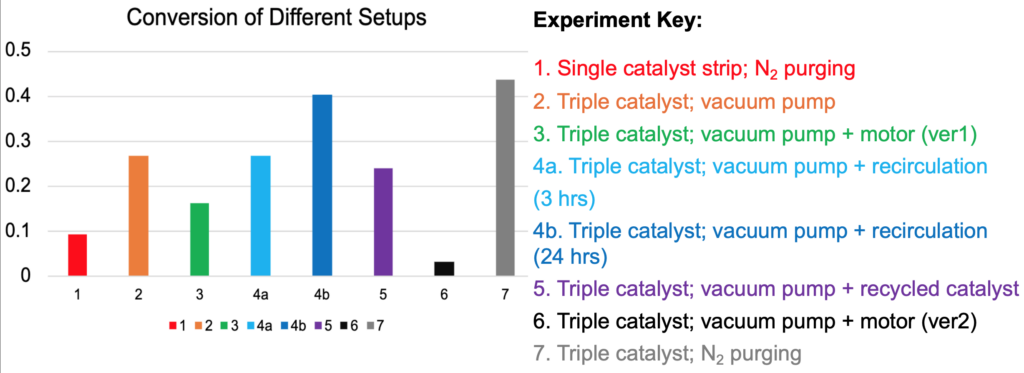
By comparing results, the following were discovered:
- Higher catalyst concentration significantly increases conversion.
- Nitrogen purging promotes higher conversion than the mechanical implementations (motor & vacuum).
- From the timeframe of 4 to 24 hours, recirculating the feed increases conversion only by about 10%.
- At 3-4 hours, the catalyst retains approximately 89% of its performance, indicating catalyst life diminishes more slowly in the continuous reactor.
Conclusions & Future Work
The conclusions for the project are presented below:
- The reaction is 1st order for both reactants, p-nitrotoluene and ammonium formate.
- Raising the concentration of ammonium formate impacts the overall reaction rate.
- Different ratios of the two proton donors (ammonium formate and acetic acid) alter the pH, which affects the rate constant.
- Increasing catalyst concentration and utilizing nitrogen purging without a motor and vacuum contribute to higher conversion in the continuous reactor.
- While the goal of 95% conversion was not achieved, calculations were done, and the conditions to do so are proposed: run in a 240-ml reactor for 8 hours at 55 °C with p-nitrotoluene, ammonium formate, acetic acid, and 1% Pd/C in a 1:4:4:0.3 equiv ratio.
For future work, it is recommended to research additional motor implementations; for example, one suggestion is to implement vertical motion instead of circular motion. Experiments can also involve varying the pressure of the vacuum pump to understand its effect on the system.
Another suggestion is to analyze the pH of the reactant solution. As discovered in the batch experiments, the pH does impact the reaction to some degree. However, time constraints did not allow for further analysis; since it could be an important factor on the catalyst performance, future groups should look into it.
Finally, it is advised to conduct a trial with the expected 95% yield conditions to validate them. The amount of catalyst can also be safely increased to further accelerate the reaction.
Acknowledgements
Team Shadow Shutter expresses sincere gratitude to Dr. Brian Cleary, our sponsor from Kodak, and our advisor Prof. Juba, for their unwavering support and guidance. We also thank Prof. Lawton, Prof. Kelley, and our TA Quintina Campbell for their inputs and following along with our progress. Special thanks to Clair Cunningham, Mason Garlatti, and Jeffery Lefler for their assistance in the lab.