
Team Members
- Angelina Yang
- Katelyn Buscetto
- Jason Lau
- Luke Park
Mentors and Faculty Advisors
- Dr. Brandon Zimmerman
- Dr. Len Zheleznyak
- Professor Jiebo Luo
Abstract
The CLEAR Digiteyez Optimization project is an exploratory Senior Design project to implement and improve various optimization routines already existing in the CLEAR digital eye test prototype. As such its design inputs were derived from our interactions with our project customer and advisors, Dr. Brandon Zimmerman, Dr. Len Zheleznyak, and Professor Jiebo Luo. Optimization and modeling for contrast sensitivity function, farsighted/nearsighted prediction, axis of astigmatism, and power vector was conducted to obtain an improved prescription prediction model. More clinical data needs to be taken for our prediction accuracy to increase.
Objective
The objective is to improve an already existing prototype software for an at-home digital eye test. The team’s requirements are outlined in the table below.
| PROJECT REQUIREMENTS |
|---|
| A complete and accurate implementation of four different optimization models in the following vision areas: Contrast Sensitivity Function, Farsightedness Prediction, Axis of Astigmatism, and Power Vector Optimization. |
| Benchmark our optimization models performance against existing routines. Complete evaluation between current team model against previous models developed. |
| Integrate final optimization routines into the current Clear Eye Test prototype. |
| Complete suite of optimization routines and additional code packaged and documented for proper handover. |
Approach
The team will explore four different areas of vision science and develop four different data optimization routines, one for each visual science area. They are categorized by contrast sensitivity function, farsighted and nearsighted prediction, axis of astigmatism, and power vector optimization. All four of these will be incorporated into the already existing eye prescription calculation algorithm to improve the current accuracy.
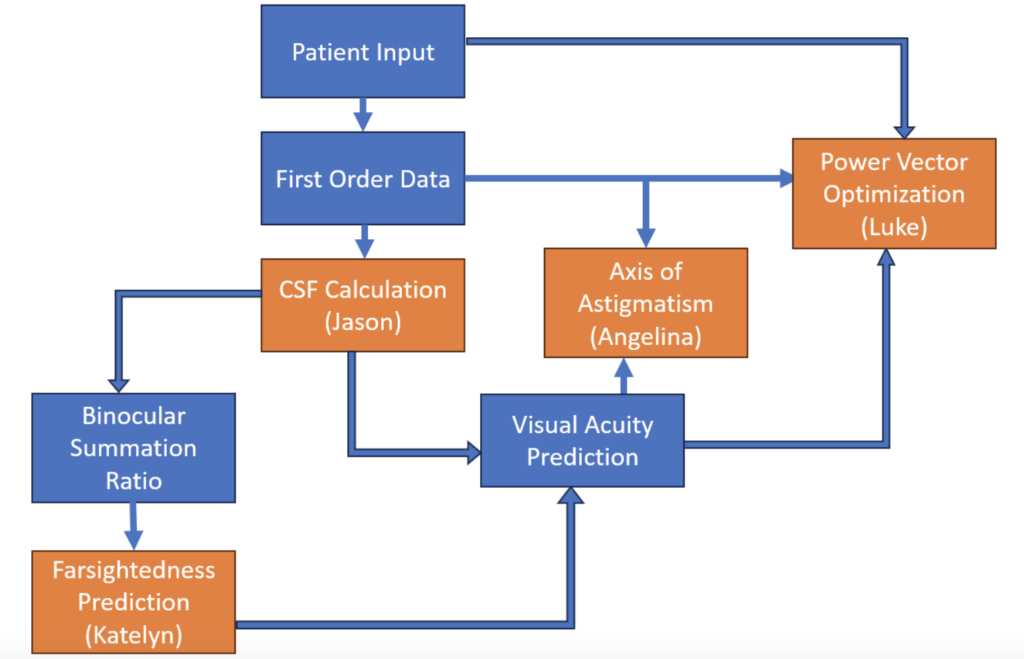
Contrast Sensitivity Function
We utilize the contrast sensitivity function (CSF) to measure the ability of a patient’s eye to resolve visual stimuli at various spatial frequencies. The CSF is a product of 1.) the MTF of the eye’s optical performance and 2.) the neural contrast sensitivity function of how our neurons process stimuli.
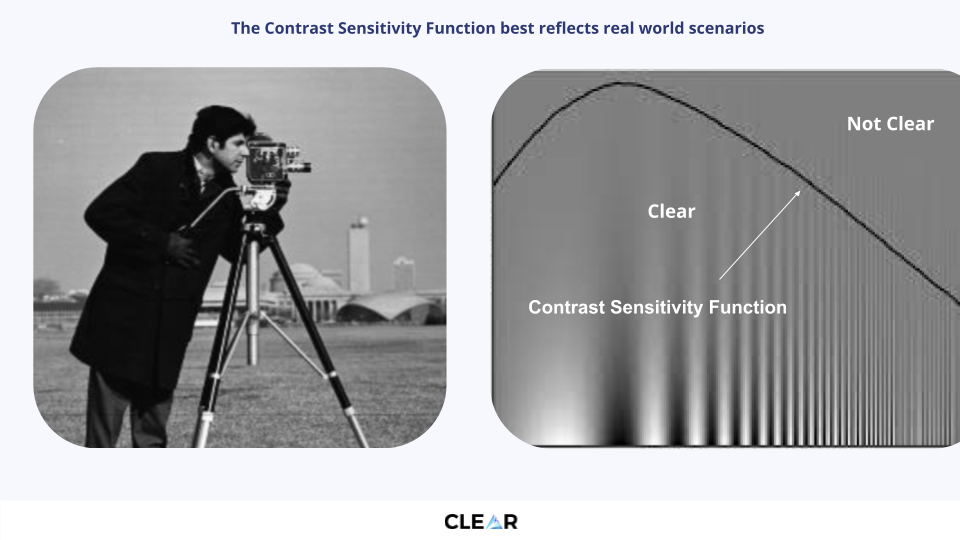
Traditionally, optometrists use visual acuity to predict a patient’s prescription. Visual acuity only quantifies the smallest object a user can see at a given distance. Because of this, CSF offers a more holistic measure of our eye’s ability to process stimulus.
The CSF of both eyes allows us to calculate the Binocular Summation Ratio (BSR). The BSR is known to be an indicator of various contrast sensitivity ailments such as cataract formation, glaucoma, and advanced macular degeneration.
A SVR prediction model is able to achieve desired baseline performance to predict CSF. We tested additional physics-based terms in our model such as user distance and gabor patches. These do not impact model performance significantly.
| Performance | Left | Right |
| 1 Line | 0.8621 | 0.8493 |
| 2 Line | 0.9241 | 0.9315 |
| Avg. Err | 0.6552 | 0.6507 |
Farsighted and Nearsighted Prediction
Farsightedness (hyperopia) occurs when a person can not see up close and needs a positive lens prescription. Nearsightedness (myopia) requires a negative lens prescription to help the wearer to see far away. Visual acuity is a value that represents how much detail a person can see in an image from a certain distance away.
We want to determine if there is any correlation between the visual acuity values measured by the Clear Eye Test and the spherical value of the user’s eye. If a correlation is determined, we would like to know if it could be used to generate a model that can predict the spherical value of the user’s eye based on acuity.
Test subjects took the Clear Eye Test and then also had their prescription measured by an actual optometrist. Using this data of known subjects with known acuities, we trained a decision tree model in Matlab to predict the spherical values of the user’s eye, which should be negative if nearsighted and positive if farsighted. This model was 67% accurate for nearsighted and 25% accurate for farsighted. This low performance is most likely due to a small training dataset and will be improved when additional data is obtained from a future clinical trial.
Axis of Astigmatism
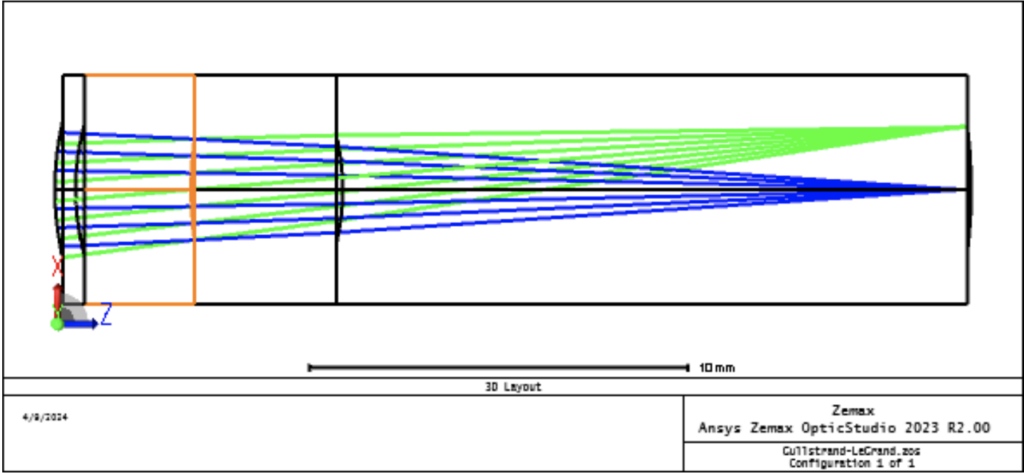
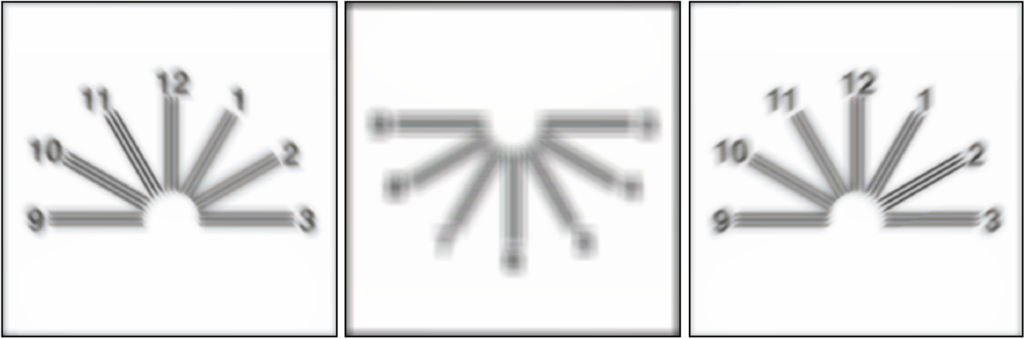
To improve the current axis measurement procedure within the prototype, we use mathematical equations to express refractive error as Zernike polynomial coefficients [1] and Zemax OpticStudio to model the behavior of refractive errors in response to the clock dial test. We can simulate the aberrations we expect a person to experience when looking at the visual stimuli.
Zernike polynomial coefficients calculated from prescription alone are an estimate that represent the aberrations, but are not equivalent to them. The same can be said about optical software image simulation and its prediction of what a person truly sees. Zemax OpticStudio image simulation gives us a preliminary look into what users might see during the astigmatism measurement procedure. The image simulations also help inform the procedure’s future design and improvements. Direct conversion of human eye prescriptions to Zernike polynomials is a nuanced problem, and further research is needed for a proper simulation.
To truly derive the algorithmic relationship between the axis of astigmatism with visual qualities, we should ideally consult an optometrist and find an alternative method that doesn’t impose our own projection through optical modeling and simulation. If this simulation is necessary for future work, we can explore directly modeling cylindrical surfaces to induce astigmatic effects that can be more reflective of the behavior of cylindrical refractive errors, or reverse-design phase maps by optimizing a surface to cancel out the “correction” of modeled prescription glasses.
However, we can still learn some valuable insights into how to move the optometry clock dial procedure into an at-home setting. As shown from our analysis, it will be challenging for users to identify a clear axis without trial lens set and phoropter to correct the effects of spherical refractive errors. Further exploration should be conducted to explore if it is plausible to allow users to adjust their own distance from the device screen or vary the size of the visual stimulus itself in a similar fashion to the contrast wheels, until they can identify one or two clear axes from the clock dial test.
Power Vector Optimization
Power vector, also known as astigmatic decomposition, is a refractive technique that calculates the net effect of sphero-cylinder lenses in combination by separating their spherical and cylindrical components [1]. We explore a direct and indirect power vector optimization approach where the direct approach will optimize for the power vector, B.
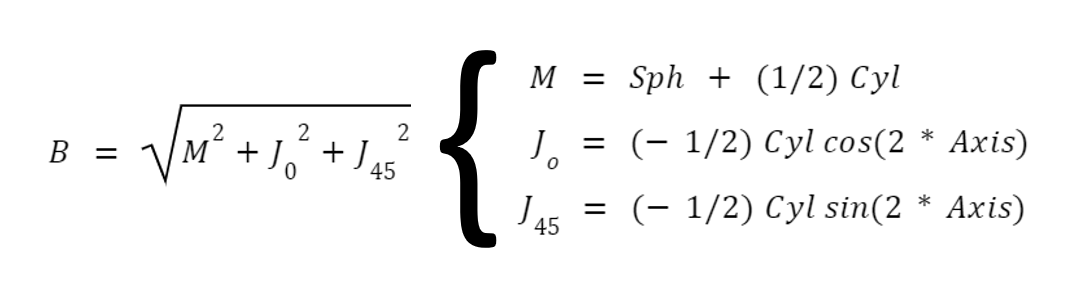
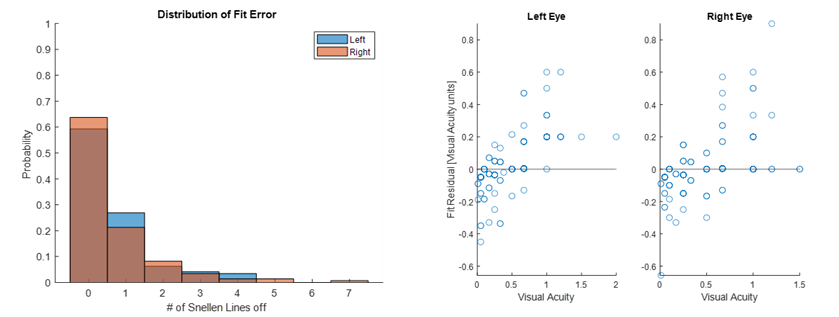
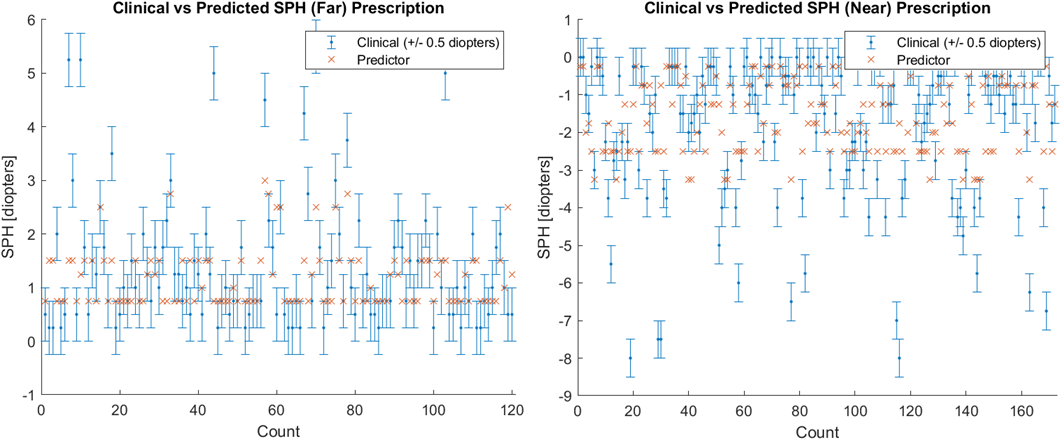
The indirect approach will optimize for individual SPH and CYL components using the same parameters as the direct approach. We utilized a Support Vector Regression (SVR) model to predict our prescriptions. Using this model, we compare the accuracy between our predicted results and our optometrist prescriptions. The following figures represent how well our predictor model fits in the 0.5 diopter range of both the clinical SPH and CYL prescriptions.
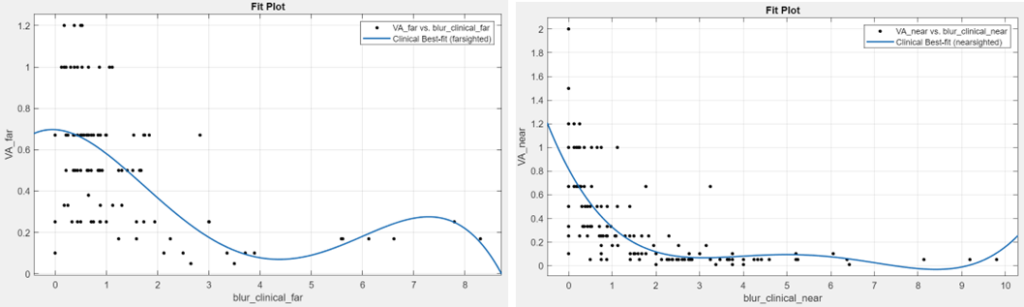
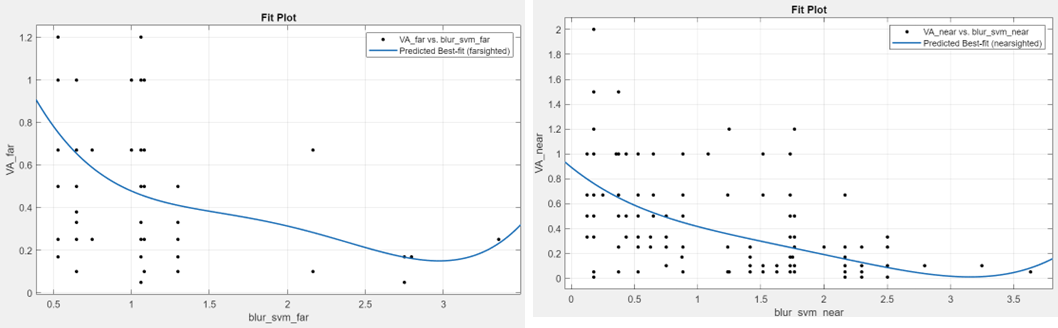
To finish up our indirect optimization approach, we want to look at the relationship between the clinical visual acuity and the refractive error (blur) from the clinical values and our predicted values. The top figure is a plot that represents clinical visual acuity vs. clinical blur separated into farsighted (left) and nearsighted (right) data. The bottom figures represent the relationship between clinical visual acuity vs. predicted blur separated into farsighted (left) and nearsighted (right) data.
Future Work
Additional patient data will be collected this summer through a clinical trial with the Flaum Eye Institute. This new patient data, along with the optimization models we worked on this year, will be used to increase the prescription accuracy of the eye exam. Once we achieve a desirable result for the models we worked on, we will incorporate those parameters into the power vector model to predict prescriptions in the final prototype.
The overall goal is to obtain a prescription accuracy of at least 80% before undergoing further clinical trials and FDA clearance.
References
[1] “ANSI Z80.28-2022: Ophthalmics – Methods of Reporting Optical Aberrations of Eyes.” VC (ASC Z80): Vision Council [vc (asc z80)].
[2] Schwiegerling, Jim. “Field Guide to Visual and Ophthalmic Optics.” Society of Photo- Optical Instrumentation Engineers, 2004.