Results
Final results from the ALS Laboratory indicated the following overall removal rates, excluding PFOA due to contamination.
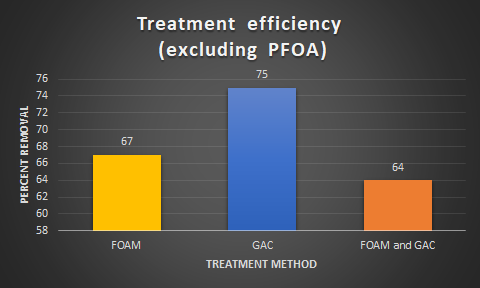
The total breakdown by PFAS compound is shown in the table below. A dash represents a data point that was not received. This may signify the compound was not detected, which would indicate 100% removal.
Overall Treatment Results
| Compound | Foam Percent Removal | GAC Percent Removal | Foam + GAC Percent Removal |
| FtS 6:2 | 86.45% | -96.77% | -203.23% |
| FtS 8:2 | 83.09% | – | – |
| PFBS | 57.69% | 95.00% | 80.00% |
| PFBA | 90.56% | 75.56% | 38.89% |
| PFDA | 43.48% | -682.61% | -59.42% |
| PFHpA | 52.31% | 55.38% | 85.85% |
| PFHxS | 78.43% | 96.67% | 94.12% |
| PFHxA | 51.72% | 83.79% | 77.59% |
| PFNA | 87.90% | – | – |
| PFOSA | 85.33% | – | – |
| PFOS | 82.90% | 90.97% | 86.45% |
| PFOA | -1257% | -13110% | -1328% |
| PFPeA | 88.18% | 92.45% | 78.18% |
| N-ethylperfluorooctanesulfonamidoacetic Acid | 66.00% | 83.33% | 78.00% |
| N-methylperfluorooctanesulfonamidoacetic Acid | 68.00% | 74.40% | 68.80% |
For foam treatment, All types of PFAS showed a decrease in concentration except for PFOA, likely due to contamination from the PFOA prototype. Although there were measures taken to minimize contamination, it is likely that the air stone used contained trace amounts of PFOA even after methanol rinsing.
For the GAC treatment, there were still PFOA contamination problems, as well as an increase in FtS 6:2 and PFDA. The source of this concentration increase is not currently known. However, certain PFAS that were not significantly removed by foam, such as PFBS for example, were very well treated with GAC. The two treatment methods function differently to remove PFAS and therefore may target different compounds, explaining this difference in removal.
Prototype results
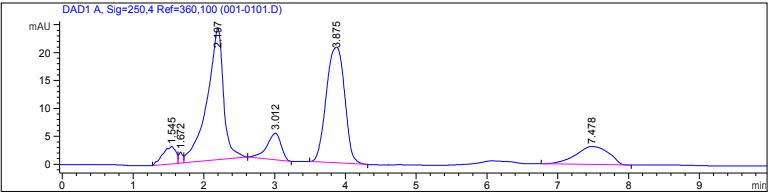
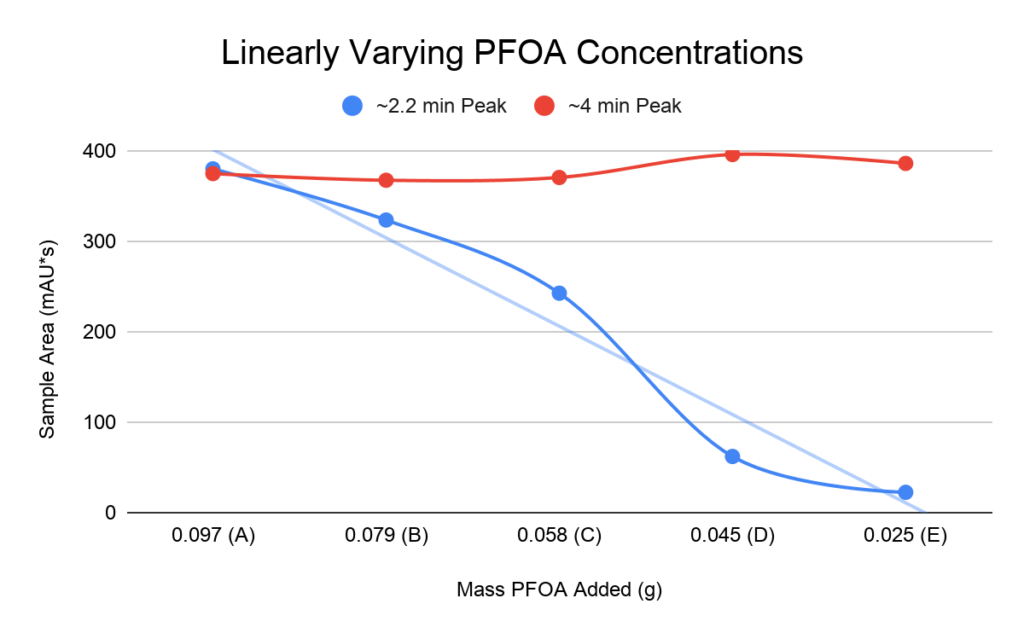
The linear calibration test on the left was conducted by creating PFOA prototype solutions with linearly changing PFOA mass. The linear dependence exhibited by the peak at approximately 2 minutes suggests that it is the PFOA peak in the chromatogram above. The 4 minute peak was later identified as impurities from using reagent-grade methanol as a solvent.
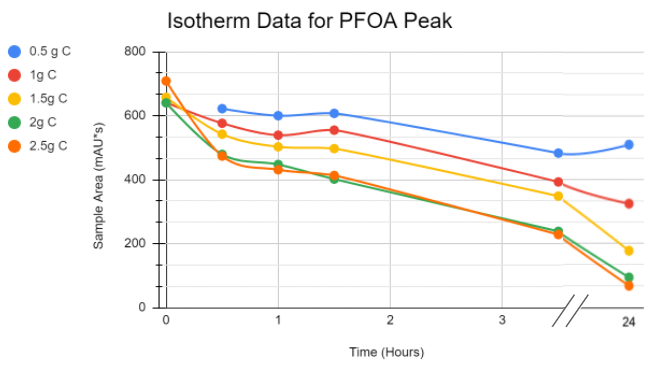
The isotherm test consisted of beakers with varying masses of carbon and 20 g/L PFOA prototype solution in each. The carbon then adsorbed some of the PFOA and we were able to observe what the peak areas and thus, concentrations, were at certain points over time. The only masses that showed signs of equilibrium by 24 hours were the .5g C and to a lesser extent, the 1 g of C.
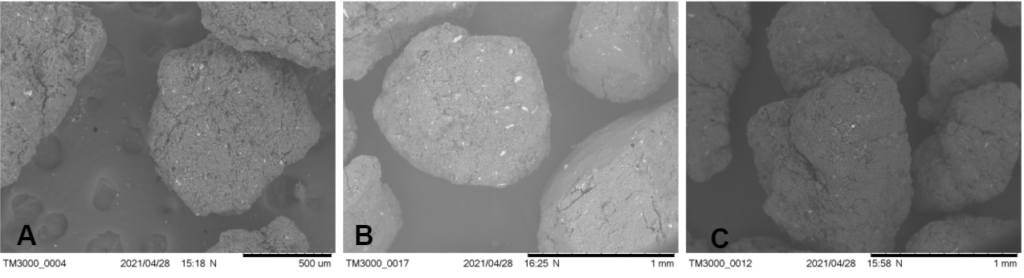
SEM images
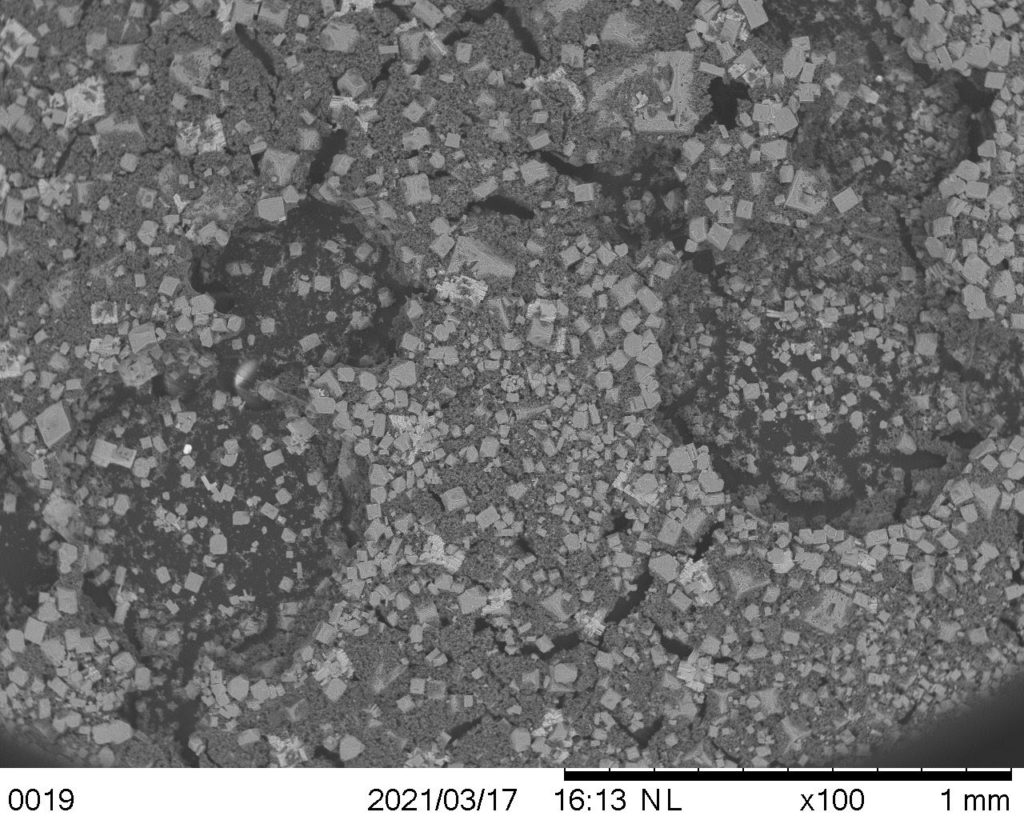
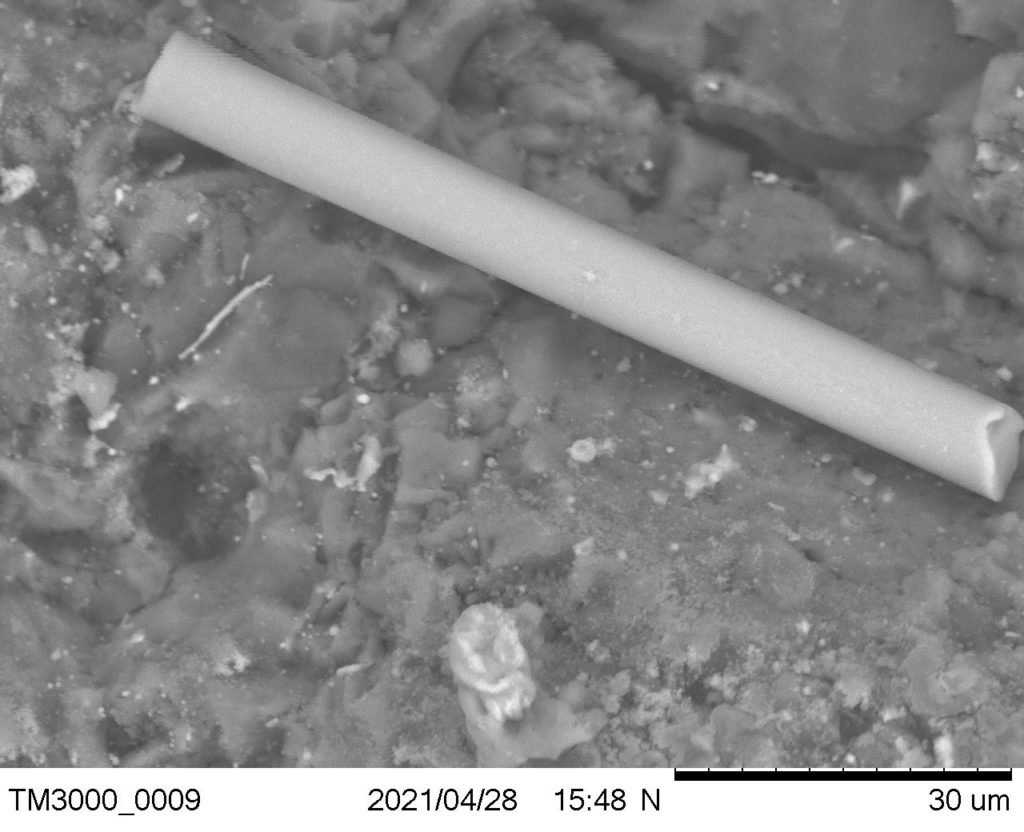
Cylindrical shaped structure on GAC surface after leachate treatment. 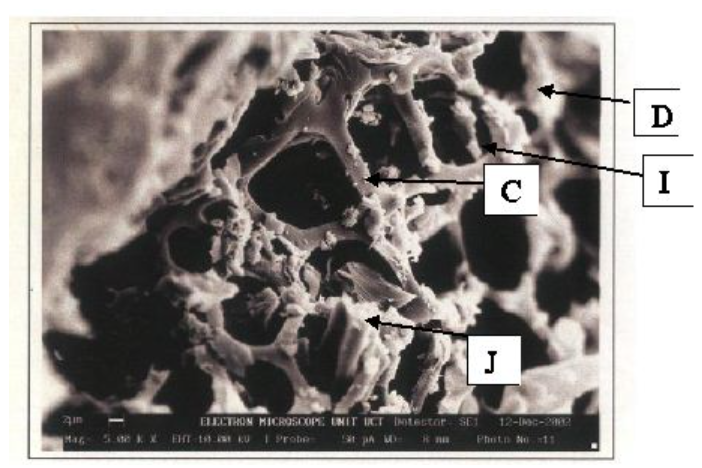
Activated carbon fibres after pyrolysis from literature.
The cylindrical shape above on the left was identified as a possible carbon fiber that wasn’t fully activated via pyrolysis. Images were compared with those captured by Achaw when studying porosity of activated carbon using SEM to confirm hypothesis 1.
Deterra Bag Treatment: An Alternative Carbon

In the picture above, the left beaker contains leachate treated over the span of three days in the Deterra Bag containing a different type of granulated carbon than used in the RSSCT. The right beaker is leftover untreated leachate. While the team was unable to include this treatment in analysis with ALS laboratories, visually there appears to be a significant coloration change suggesting possible PFAS removal of combined liquids and solids.