

Department: Biomedical Engineering
Supervisor: Whasil Lee, PhD
Customer: Lisa DeLouise, PhD
What is the Pluck and Dispense System?
The Pluck & Dispense System (PDSys™) automates the precise transfer of cells from microbubbles to wells, enhancing accuracy and efficiency in laboratory research. This system addresses key challenges such as reducing human error and increasing throughput, making it a valuable tool for small pharmaceutical companies or academic researchers working with microbubbles. This technology is under active development at the University of Rochester in the DeLouise Laboratory and will be acquired by Nidus MB Technologies for commercialization and manufacturing upon completion.
Final PDSys™ Prototype
Initially, the PDSys™ could only transfer cells to and from microbubble arrays manually, a process that was both tedious and time-consuming. In response to customer feedback and the need for enhancements, our design team focused on improving the system’s autonomy and operational efficiency by integrating machine vision software. Key upgrades include a new graphical user interface (GUI) that offers more intuitive monitoring and interaction, machine vision software that generates a spatial map of the stage using 3D-printed plate clips, and additional machine vision capabilities that automate the capillary’s descent into the microbubbles.
Capillary Descent Program
In our final prototype, automating the capillary descent into microbubbles is a key feature facilitated by advanced machine vision techniques. First, the system processes the image using Otsu’s thresholding method to differentiate the capillary tip from the background. This method automatically determines the optimal threshold value for the grayscale conversion, enhancing the contrast between the capillary and its surroundings. Following thresholding, the image undergoes edge detection using the Canny algorithm.
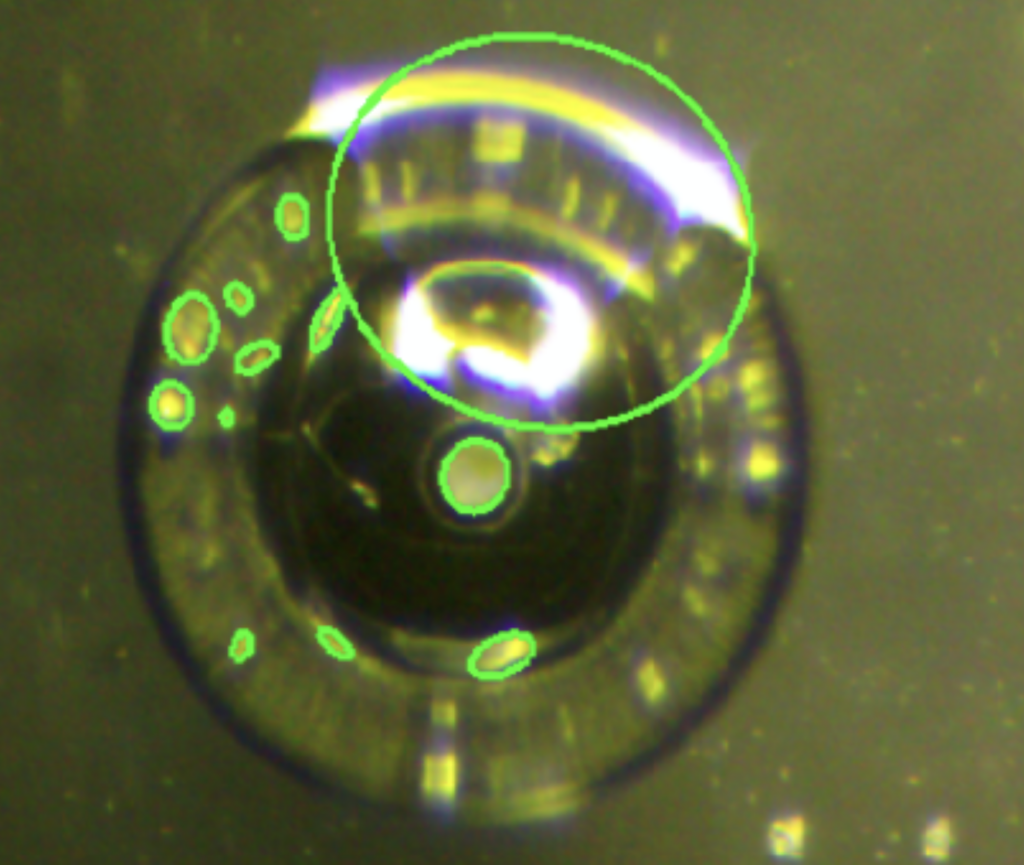
This edge detection is crucial as it outlines the boundaries of shapes, particularly the capillary and potential microbubbles. The system then applies the Simple Chain Approximation algorithm to detect shapes in the image, focusing on identifying elliptical shapes which correspond to the capillary tip and the microbubbles.
We integrated an “Automatic Z Descent” button into the GUI. When activated, this feature controls the descent of the capillary, continuously lowering it while the system monitors and reports the number of detected ellipses. The descent automatically halts when a second ellipse is identified, indicating that the capillary tip has reached the proximity of the microbubble—specifically, it suggests that the tip is close enough to be visually detected as entering the inverted microbubble.
Spatial Mapping Program
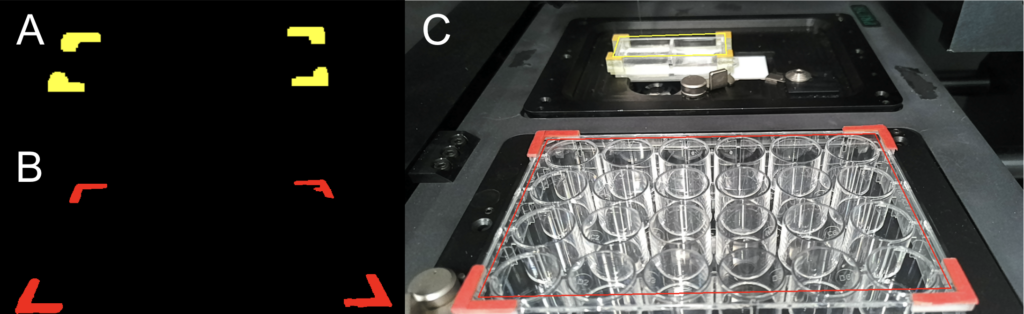
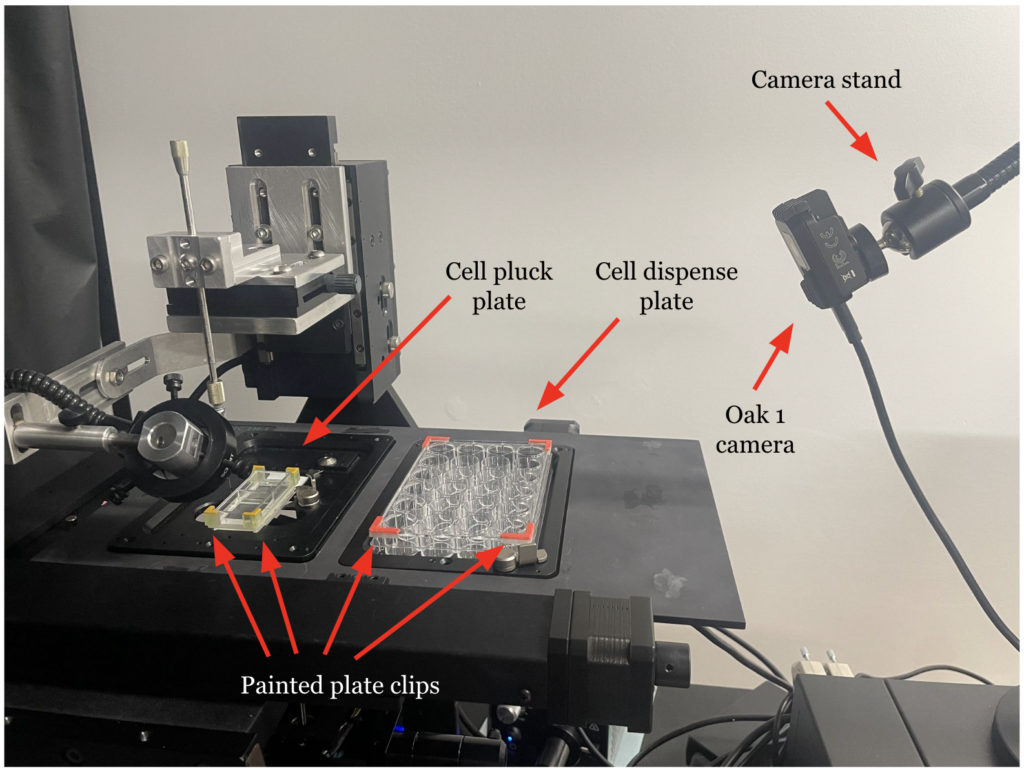
Another major addition based on machine vision is the spatial calibration of the capillary tip relative to well plate locations. Images are captured using an Oak D-1 Camera and processed with two masks that filter based on a predefined set of HSV values matching the colors of the plate clips (Fig. 3A, 3B). Using the OpenCV library, morphological operations are performed, and large clusters of yellow and red pixels, indicative of plate clips, are filtered by size. The contours of these pixel clusters are then identified, the inner corners are pinpointed, and a convex hull, representing the plate, is created. These convex hulls are mapped to the actual dimensions of the arrays to establish a relationship between the plate’s pixel dimensions and its actual measurements, facilitating spatial movement of the stage based on pixel values.
To align the pixel coordinates with real-world measurements, the camera is calibrated using Python to calculate the camera’s intrinsic matrix and distortion coefficients, based on sensor properties. Once spatial detection code identifies the arrays in space, pixel coordinates are converted to real-world coordinates using the intrinsic values and distortion coefficients with the following equations:
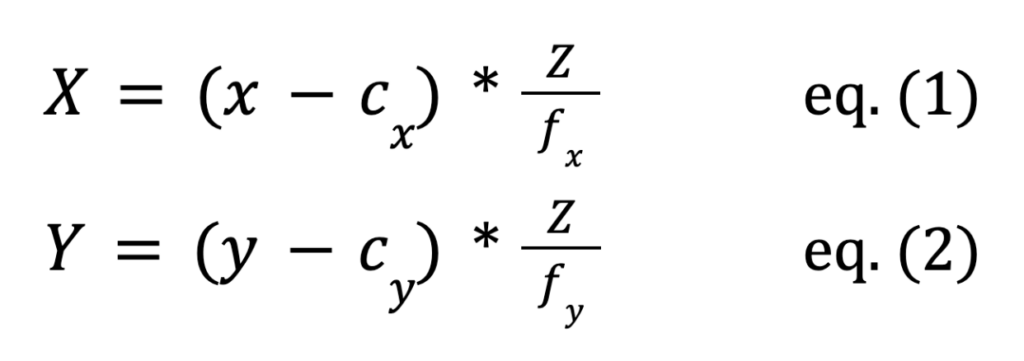
Here, X, Y, and Z represent real-world coordinates in space (in microns or another unit specified by the user), while x and y are pixel coordinates, cx and cy denote the optical center from the camera matrix, and fx and fy the focal lengths. These real-world coordinates integrate with the existing GUI functions, allowing the stage to move based on micron values.
Plate Clips for Spatial Mapping
Plate clips were designed for use with the spatial mapping program using SOLIDWORKS and produced using a resin 3D printer. Two types of clips were created: one for the destination well plates (Fig. 4) and another for the microbubble array (Fig. 5). The design of the clip for the destination well plate is compatible with most standard well plates, which typically have similar top edges. Each clip is engineered to snap onto the top corner edges of the plate. Since some plate corners are flat or slanted, meaning they do not form a perfect right angle, a gap was incorporated between the inner edges of the clip to accommodate both full and flat corner edges. Four such clips were printed to equip each edge of a plate, and each clip was painted orange for visibility and identification.
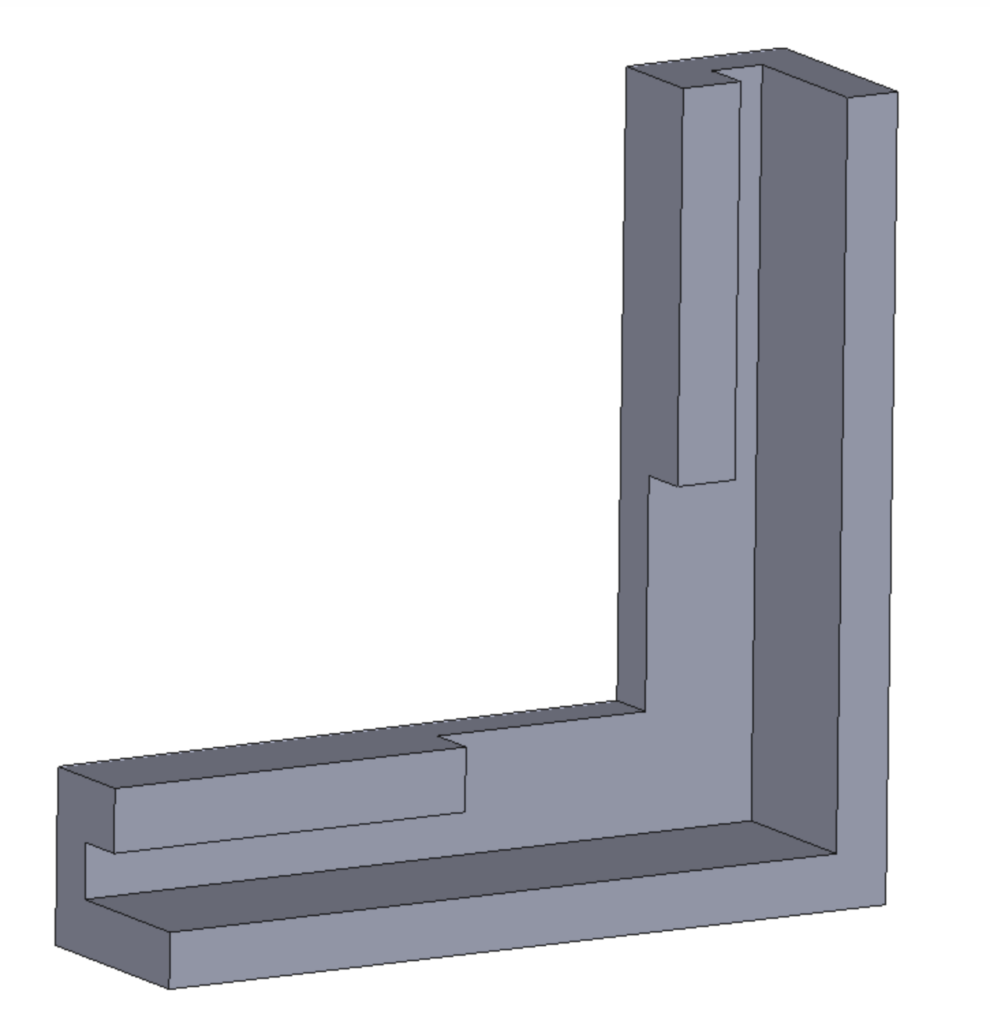
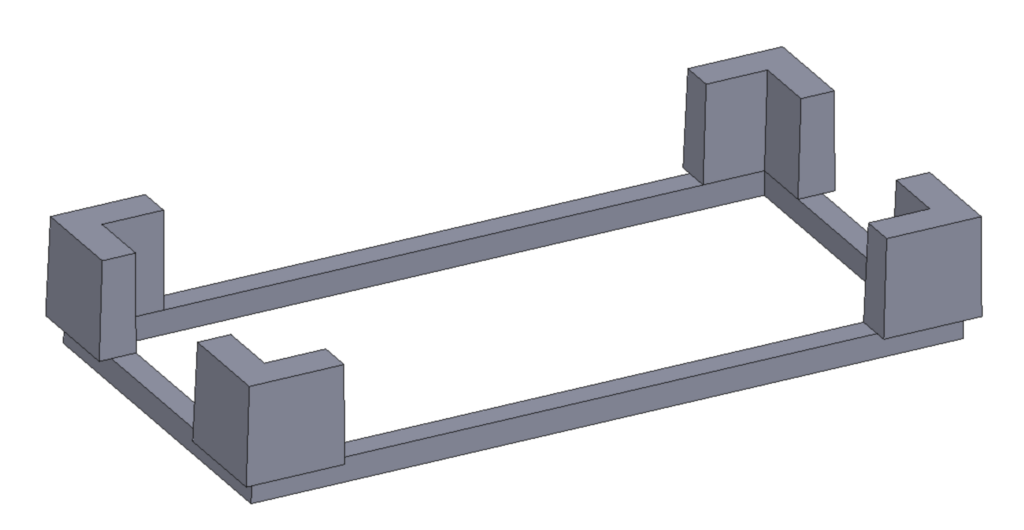
For the microbubble array, designing individual plate clips that attach to the edges without obstructing the capillary was challenging. To address this, the clips were consolidated into a single piece that wraps around the frame of the microbubble plate, resting on a bottom ledge. As shown in Figure 11, the L-shaped clip parts essential for spatial mapping are elevated to sit just above the top of the well, ensuring the camera can easily capture all corners. After printing, only the top face of these L-shaped parts was painted yellow to enhance visibility.
Graphical User Interface Improvements
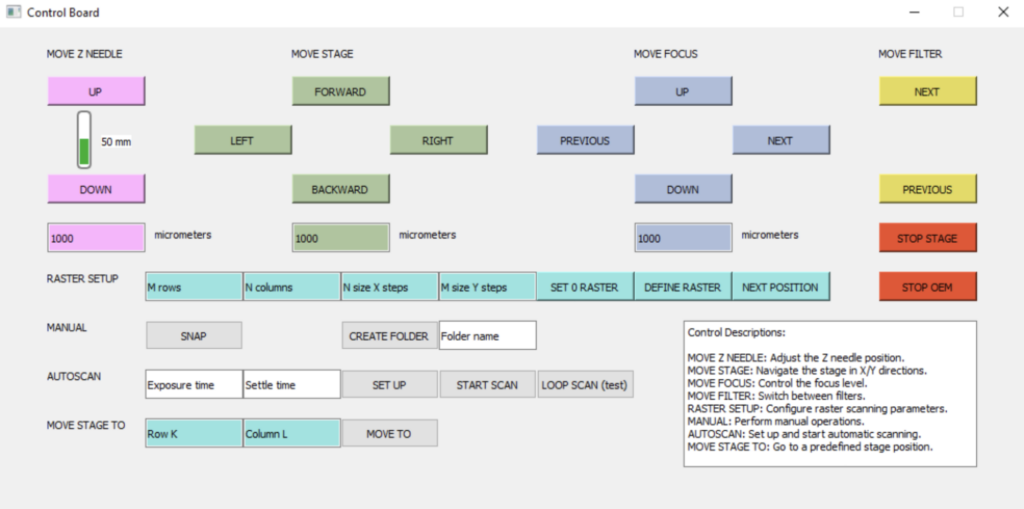
Regarding software updates, refining the graphical user interface (GUI) was crucial as it is the primary means for users to interact with and control the device. The first improvement involved implementing a monitoring bar that displays the current position of the capillary tip relative to the total range of movement possible by the z-axis robot. A control description was also added to the bottom right corner of the window to provide new users with clear instructions for manually experimenting with the PDSys™ controls. Furthermore, units are now included in the input fields where users specify the movement magnitude, clarifying the extent of movement for the stage or z-axis capillary robot when a value is entered. The current GUI for controlling the PDSys™ is show in Figure 6, below.
Component List and Cost Breakdown
| Part | Retailer | Description | Estimated Cost |
|---|---|---|---|
| ProScan III Package * | Prior Scientific Instruments | Inverted microscope, motorized XY stage, z-axis motion arm, filter wheel, focus mechanism, and Joystick | $55k |
| CellTram 4R Oil * | Eppendorf | A hydraulic, oil filled microinjector used to manually aspirate and dispense cells | $3,944 |
| Oak-1 Camera | Luxonis | 12 MP central RGB camera with auto-focus, 4056 x 3040 resolution, equipped with a RVC2 core | $169 |
| Webcam stand | InnoGear (Amazon) | Camera stand for OAK-1 camera | $21.55 |
| Plate Clips | 3D printed on a Form3+ Printer | 4 clips for the large well plates and one circumferential clip for the microbubble array chips, printed in clear V4 Resin (13 mL total) | $1.94 |
| Colored Masking Tape | Mr. Pen (Amazon) | Various-colored masking tape for spatial localization program | $7.61 |
Future Directions
As development of the PDSys™ moves forward, it will be crucial to continue with additional prototyping, focusing on key improvements to boost both system performance and reliability. One priority should be redesigning a frame for the PDSys™ that minimizes movement and facilitates easier positioning of the capillary arm, providing a more stable platform crucial for precise operations. Additionally, implementing machine learning algorithms could significantly enhance the system’s capabilities, automating and improving the accuracy of microbubble detection and capillary positioning through real-time visual feedback. Rigorous testing with cells is also essential to validate the system’s effectiveness under real-world lab conditions, particularly its ability to maintain sterility and handle biological samples efficiently. Furthermore, automating the aspiration system could increase efficiency and minimize human error. Each of these areas requires thorough testing and refinement, and may benefit from consultations with specialists in automation, microscopy, and cell biology to ensure the system meets both technical and clinical research standards.
Acknowledgements
We would like to thank our customer—Dr. Lisa DeLouise, our faculty advisor—Dr. Whasil Lee, our graduate advisor—Jazmin Phommavanh, and our software consultant—Keith Bozek for their contributions to this project.