Author
- Calista Courtney
- Megan Pung
- Sophie Sweet
Mentor
Katlyn Conway and Professor Griffin
Abstract
Plug Power’s internal R&D lab lacks the space for full-scale coating and drying equipment. Their current drying process involves a 480 ft/min high-velocity fan blowing over the coating in parallel, which takes four minutes for a sheet sample. A new process must be designed for the lab drying process to shorten the drying time without a negative effect on the performance of lab coatings. The new process setup is placing the coating on a 40⁰C hot plate while a fan at 410 ft/min directly down. The results exhibit drying times below 30 seconds and do not negatively impact performance.
Introduction
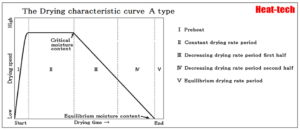
Drying time is restricted by the rate-limiting step at the molecular level. Mass transfer relies on a concentration gradient, driving solvent migration to the solid’s surface via internal diffusion. Subsequently, the solvent diffuses into the atmospheric air, known as surface diffusion. A surplus of applied heat can form a barrier, prolonging drying time. Using the critical moisture content (CMC) graph shows the transition from constant to decreased drying rate.
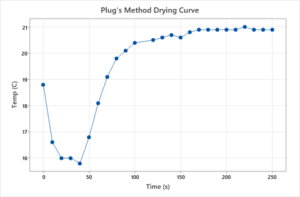
Plug has tried different methods. The fan as their best provides insight that their ink’s drying rate is limited by surface diffusion. To relate dryness to temperature, a control trial was run. During their four-minute run, an IR thermometer recorded the temperature every 10 seconds. Their process defines dryness at 20.9℃.
Method
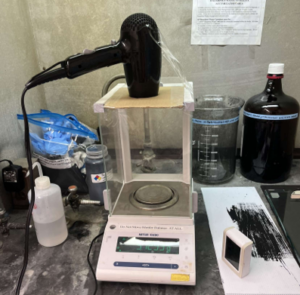
Using a hair dryer, the coating samples reached the defined dryness temperature in less than a minute. This method’s success redirected the design towards combining temperature and airflow.
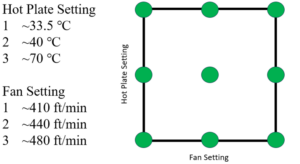
A 2 by 2 with midpoints DOE tests the factors (hot plate temperature and fan airflow directly down) impact on drying time. The coating’s center temperature was recorded every 15 seconds.
Results
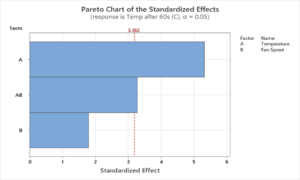
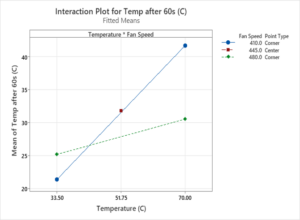
Figure 6 suggests that adjusting both temperature and airflow together can boost drying efficiency. Figure 7 illustrates how changes in one variable affect the other. The slope of the 410 ft/min line is steepest, indicating that the interaction at this speed depends more on the hot plate temperature to increase the coating temperature.
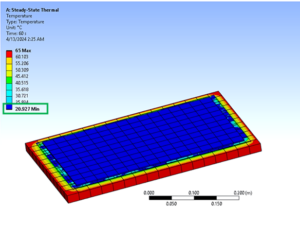
Ansys software simulated the temperature gradient. The airflow was set to blow directly down at 410 ft/min, and the hot plate power rate was set to manufacturing specification. The hot plate set point was varied. Ansys helped define the hot plate temperature set point to be 40℃ due to the minimum temperature after 60 seconds being the defined dryness temperature of 20.9 ℃.
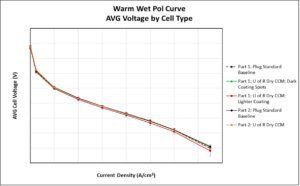
In warm, wet fuel cell operating conditions, the cells dried using the U of R method perform within the standard noise of the baseline. Part 2 showed similar results to the part 1 baseline and dark coating spots. There was also improved performance over the lighter coatings from part 1.
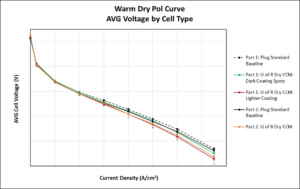
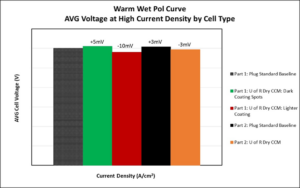
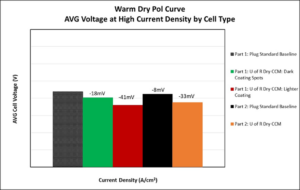
In warm dry conditions fuel cell operating conditions, there was an 8mV difference in performance between the part 1 and part 2 baseline parts. Less than 10mV is a normal and expected variation for the same type of parts. U of R part 2 trials show an improvement over the lighter coatings from part 1 but not the darker coatings from part 1.
Final Design
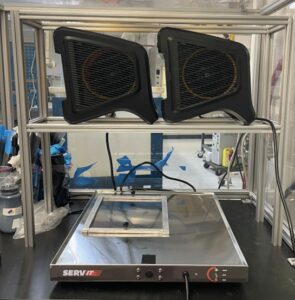
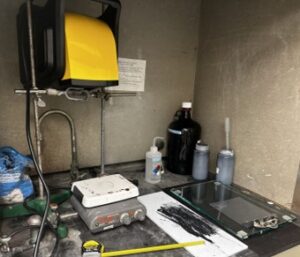
The final design includes a shelf built to hold that fan(s). The shelf’s height is adjustable to measure the effects of fan height in later trials. The materials are all safe for use in the fume hood. The fans are connected to a power strip with an on-off switch. A weight was constructed to secure the coatings on the hot plate. The design is large enough to dry two coatings simultaneously. The final design decreases the drying time from 4 minutes to 30 seconds.
Improvements
- Drying two 9” x 12” coatings on a 30” hot plate with individual fans positioned above each coating can effectively reduce the drying time for one coating to approximately 15 seconds.
- Maintaining a temperature below 40⁰C during the anode coating process will mitigate issues such as puddling and ensure optimal coating quality.
- Constructing a design that implements a vacuum seal to this process to secure the film in place will greatly improve process flow.
Conclusion
Significant improvements were made to Plug Power’s drying process. It was discovered that uniform backside heat applied to the coating results in faster drying times. Through software modeling, the optimal temperature for drying was determined to be 40°C. This heat, combined with airflow of 410 ft³/min, allows the coating to be completely dry in 30 seconds. This results in very close performance between cathode coatings and Plug’s standard baseline coatings. The anode coatings showed lower performance but not outside of the standard experimental noise. This is due to slight puddling. To mitigate this, anode coatings should be dried at lower temperatures.
References
Talukdar, K.; Delgado, S.; Lagarteira, T.; Gazdzicki, P.; Friedrich, K. A. Minimizing Mass-Transport Loss in Proton Exchange Membrane Fuel Cell by Freeze-Drying of Cathode Catalyst Layers. J. Power Sources 2019, 427, 309–317.
3-4.Five patterns of the drying curve | HEAT-TECH. https://heater.heat-tech.biz/air-blow-heater/science-of-the-drying/hot-air- drying-and-infrared-ray-drying/basic-knowledge-required-for-optimization-of-the-drying- process/10123.html (accessed 2024-02-05).
Acknowledgments
Talukdar, K.; Delgado, S.; Lagarteira, T.; Gazdzicki, P.; Friedrich, K. A. Minimizing Mass-Transport Loss in Proton Exchange Membrane Fuel Cell by Freeze-Drying of Cathode Catalyst Layers. J. Power Sources 2019, 427, 309–317.
3-4.Five patterns of the drying curve | HEAT-TECH. https://heater.heat-tech.biz/air-blow-heater/science-of-the-drying/hot-air- drying-and-infrared-ray-drying/basic-knowledge-required-for-optimization-of-the-drying- process/10123.html (accessed 2024-02-05).