Team Deception
- Rebecca Choi
- Anna Maria Petkoska
- Riley Prewett
Faculty Mentor
- Marc Porosoff
Saint Gobain Sponsors
- Eli Kosson
- Rogeria Bingre
Abstract
Zeolite 13X is a known crystalline structure that is commonly used to adsorb CO2. The diffusion parameters of CO2 into the zeolite, however, are not well understood. It is important to accurately model the diffusion process to optimize zeolite pellet formulation and increase carbon capture. Three methods for measuring adsorption kinetic data are explored in this project: a TGA, an AutoChem II, and a PBR paired with a TCD. The TGA was the most controllable and reliable data collection method. From the TGA results, the diffusion coefficient was found to depend on temperature and flow rate, when operating under 98 mL/min, and found to be between 13.3 and 2.9 min-1. The saturation capacity of the pellets was found to depend only on temperature and was measured to be between 3.59 and 4.29 mol CO2 per kg pellet for temperatures between 25°C and 45°C.
Introduction
Zeolite 13X and Boehmite are combined to make porous pellets for carbon dioxide (CO2) adsorption applications. Three approaches are explored to find a repeatable and accurate method for collecting data to model CO2 diffusion into these pellets. All methods use the following data collection procedure:
- Pretreatment: Nitrogen (N2) gas flow, 40 mL/min, ramp to 200℃ at 20℃/min and hold for one hour. Desorbs any water adsorbed by the pellets from the atmosphere.
- Adsorption: CO2 gas flow (varying concentration and flow rate depending on method), ramp to 30℃ at 30℃/min and hold for 30 minutes. Instruments measure gas concentration/sample mass to determine CO2 uptake.
- Desorption: N2 gas flow, 40 mL/min, ramp to 200℃ at 30℃/min and hold for one hour. Desorbs all CO2 uptake and prepares pellets for re-use.
A Python script is used to calculate pellet capacity and diffusion coefficients by fitting experimental data to a diffusion model. The capacities are compared to literature and diffusion coefficients are compared between methods to determine which is most reliable.
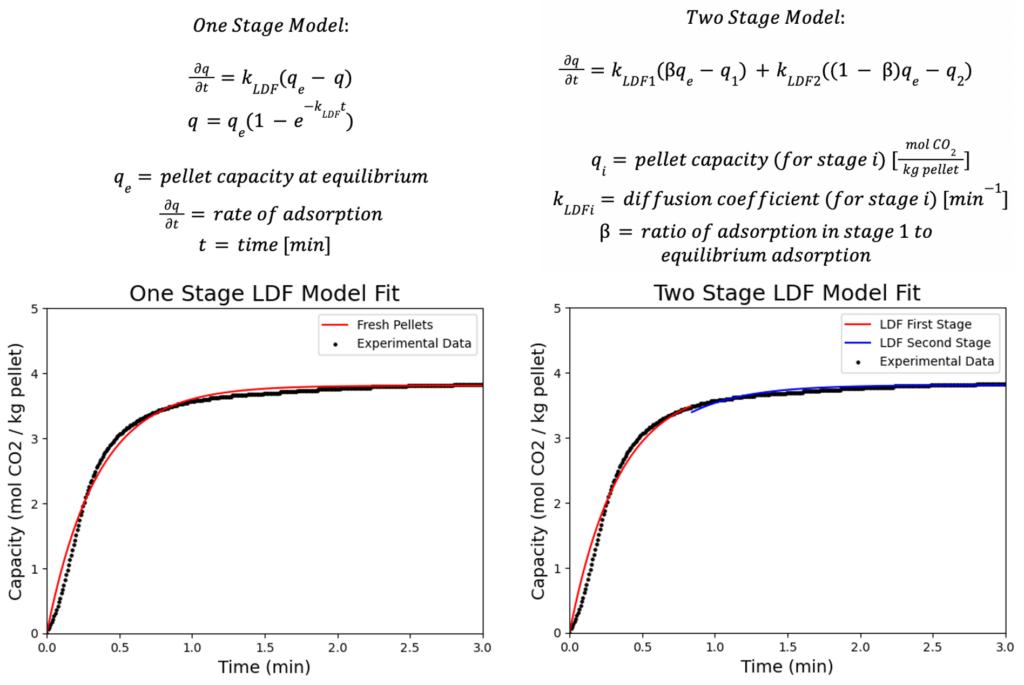
Diffusion Model
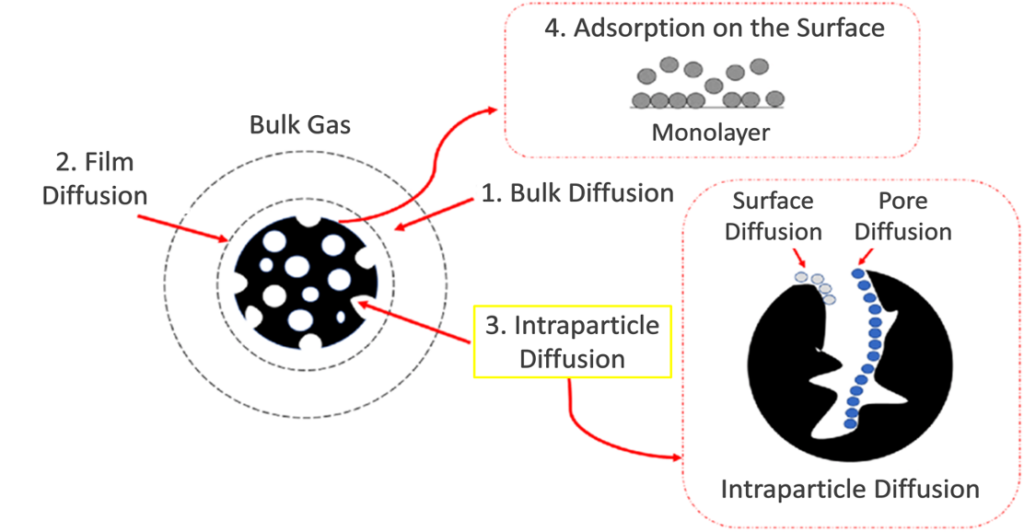
Diffusion processes consist of three main diffusion regimes: bulk diffusion, film diffusion, and intraparticle diffusion, the focus of this project. High concentrations and high flow rates are used to neglect bulk and film diffusion [1]. To study the intraparticle diffusion, the Linear Driving Force (LDF) Model is used in one and two stage variations with the following assumptions:
- Isobaric and isothermal conditions
- Neglect bulk diffusion because high of concentrations and flow rates of CO2
Method I: Thermo-Gravimetric Analyzer (TGA)
A thermal gravimetric analyzer (TGA) measures changes in mass with time and temperature. It is used to measure adsorption data for this project by measuring the mass change of the zeolite pellets as they adsorb CO2 that is flown over them in 100% concentration. Two different gases can be flown into the TGA: N2 for pretreatment and desorption steps, and CO2 for adsorption steps (through the compressed-air port). Pure CO2 is used during adsorption steps to minimize the gas side resistance.
Results:
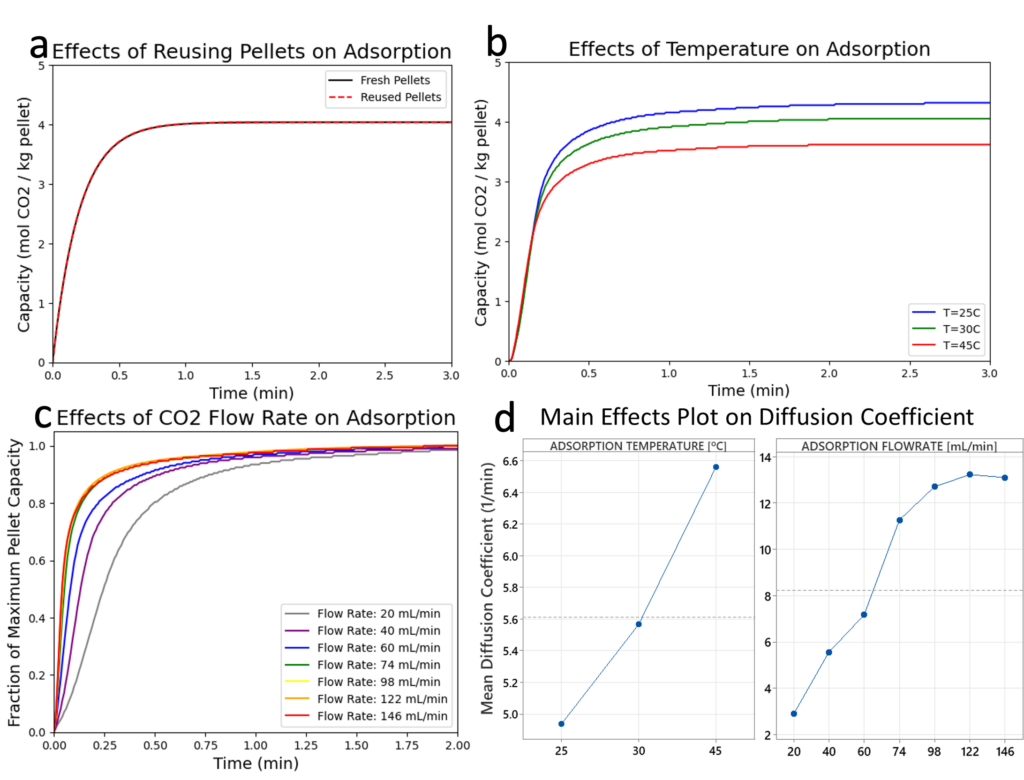
- Pellet capacity [mol CO2/kg pellet] remains constant between trials. This indicates the pellets are reusable and the desorption step is successful in desorbing all CO2.
- An increase in temperature decreases the pellet capacity.
- The diffusion coefficient increases with increasing CO2 flowrate until about 98 mL/min. Beyond this, CO2 diffusion from the bulk gas to the pellet surface does not limit overall adsorption rate – gas side resistance can be neglected.
- The diffusion coefficient increases with increasing adsorption temperature.
| TGA Data Summary | ||
| Average Capacity, 30°C (mol CO2 / kg Pellet) | Literature Capacity (mol CO2 / kg Pellet) [4] | Intraparticle Diffusion Coefficient, 30°C (min-1) |
| 4.17 ± 0.32 | ~4.0 | 12.5 ± 0.8 |
Method II: AutoChem II
The AutoChem II is a chemisorption instrument that utilizes a thermal conductivity detector (TCD) to measure changes in CO2 concentration over time and temperature changes. It measures CO2 concentration change of the 10% CO2 in helium gas mixture that is fed to the sample. Integrating the peak area of the TCD signal versus time data gives total CO2 adsorbed by the pellets when paired with a pulse injection calibration of known volume.
| AutoChem II Data Summary | |||
| Trial | Temperature (°C) | Capacity (mol CO2 / kg Pellet) | Literature Capacity (mol CO2 / kg Pellet) [4] |
| 1 | 40 | 0.18 | ~2.7 |
| 2 | 30 | 0.17 | ~3.0 |
Results:
- Concentration of CO2 in gas flow was only 10%, so bulk diffusion may not be negligible.
- Pellet capacity is an order of magnitude below expected literature values. This could be due to calibration completed with a CO2 volume that was just a tenth of the volume used in adsorption trials.
- Consistency between trials suggests error in the signal calibration, however, capacity is inconsistent with temperature trend in TGA data.
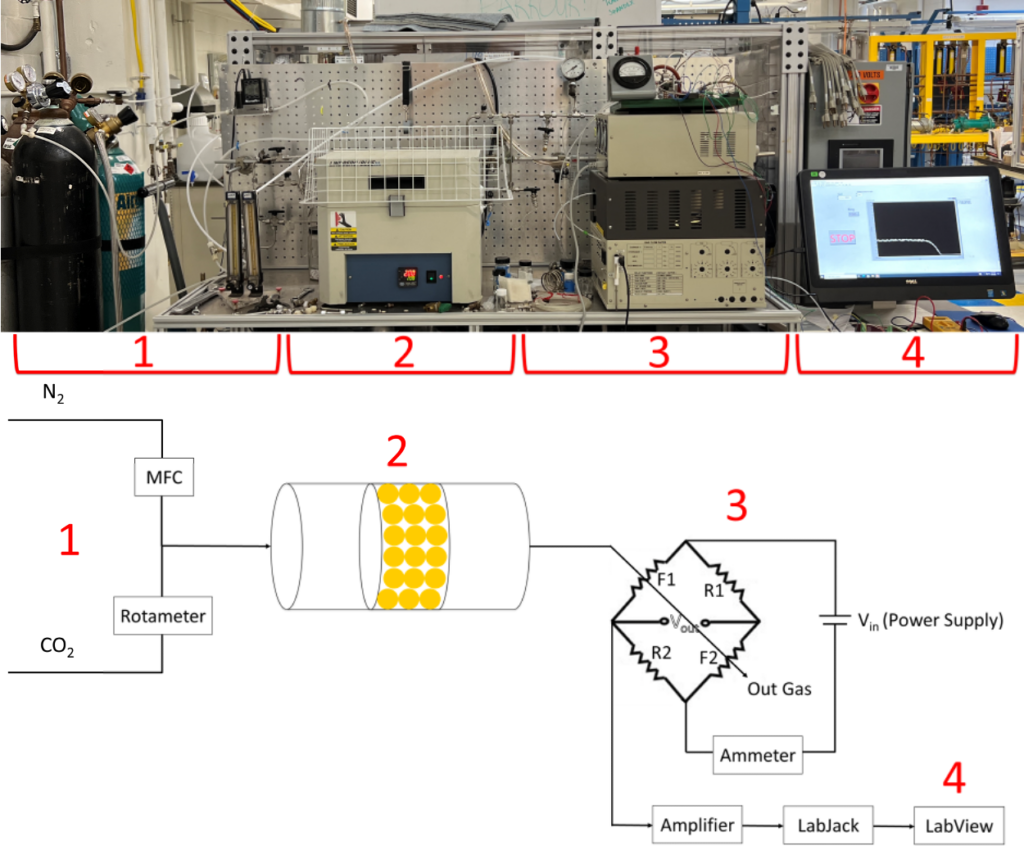
Method III: Packed Bed Reactor (PBR) and Thermal Conductivity Detector (TCD)
For the packed bed reactor (PBR) and thermal conductivity detector (TCD) setup, a gas mixture of N2 and CO2 is flown through the pellet-filled PBR and the TCD measures the concentration of the reactor output. The TCD is composed of two filaments and two adjustable resistors configured in a Wheatstone Bridge circuit. When current is passed through the bridge, it generates heat in the filaments which changes their resistivity. When different gases pass over the filaments, the thermal conductivity of the gas changes the temperature and therefore the resistance in the filament. The voltage output is measured to track the concentration of CO2.
Results:
- Packed bed produces lower diffusion coefficient due to added step for diffusion between pellets.
- Variance from literature capacity suggests error in measurement, likely due to pressure increase in reactor varying rotameter setpoint for CO2 flow.
| PBR/TCD Data Summary | ||
| Capacity (mol CO2 / kg Pellet) | Literature Capacity (mol CO2 / kg Pellet) [5] | Diffusion Coefficient (min-1) |
| 5.8 | 4.8 | 1.9 |
Conclusion and Future Work
The most reliable and accurate method for the collection of adsorption data is the TGA. Capacity data mirrored literature values, the negligence of gas side resistance was confirmed, and capacity/diffusion coefficients were consistent between trials.
It is recommended that other diffusion models are explored to model the adsorption data before 98 mL/min, where gas side resistance cannot be neglected. This can provide a better fit of the data and more accurate analysis of what assumptions can be made for the adsorption system.
Additional time with the AutoChem II is suggested for obtaining another calibration with a larger amount of CO2 that aligns with amount used in adsorption experiments.
Future work to reduce the numerous sources of error in the PBR and TCD setup:
- Replace the rotameter CO2 flow controller with a digital mass flow controller to reduce the effects of pressure increase from the PBR on flowrate.
- Utilize four total filaments (instead of two) to create a full Wheatstone Bridge setup. This will eliminate error from the two adjustable resistors. The CO2 gas mixture can then flow as a reference gas before entering the reactor, therefore only concentration changes from passing through the reactor will be displayed by the TCD signal. This eliminates error from differentiating between N2 and CO2 signals.
- Explore use of CO2 concentration detectors that are designed to provide concentration change data directly.
Acknowledgements
We would like to thank Professor Porosoff for his guidance as our advisor and Clair Cunningham for his ongoing support throughout the project. We would also like to thank Professor Lawton, Mason Garlatti, Quinny Campbell, and the CHE Department. Finally, we would like to thank our sponsors Eli Kosson and Rogeria Bingre from Saint-Gobain for sponsoring the project as well as for their continuous assistance.