Team Members:
- Shengyuan Huang
- Xueting Wang
- Haoxuan Ma
- Yan Jiang
- Yuhan Chen
Project background
The coronavirus disease 2019 pandemic leads to serious morbidity and mortality across the US, which is disproportionately affecting racial and ethnic minority populations and elderly people. High acceptance of COVID-19 vaccines will be critical to ending this COVID-19 pandemic.
One of previous nationally representative survey studies showed that self-reported likelihood of getting a COVID-19 vaccine declined from 74% in early April to 56% in early December 2020.
Project vison and goals
Vision:
- Explore public perception on COVID-19 vaccine by analyzing social media platform data (Twitter).
- Characterize and compare country-level and states-level attentions to COVID-19 vaccine.
- Provide guidelines for future social media research on the associations of pandemic vaccine and public opinions.
Goals:
- Use the streaming data crawled from the Twitter API to filter COVID-19 related Tweets.
- Extract relevant features to explore longitudinal trends of Tweets and compare distributions across different countries and states in the US.
- Perform sentiment analysis towards vaccine across different regions.
- Perform topic modeling analysis on periods that have highest or lowest average sentiment scores
- Estimate their demographic info based on their Twitter profile images.
Data Description
The raw data is the streaming twitter data from the twitter API which is in the format of json file. The time span of our data is from March 5, 2020 to January 25, 2021. There are 36 features and more sub features. The most important ones are UserID, The text from the tweet, the date when the tweet was sent, user location and the url for the user’s profile picture.
The raw data was downloaded from Box because Professor Zidian has uploaded all 23 files into the box previously.
Data preprocessing
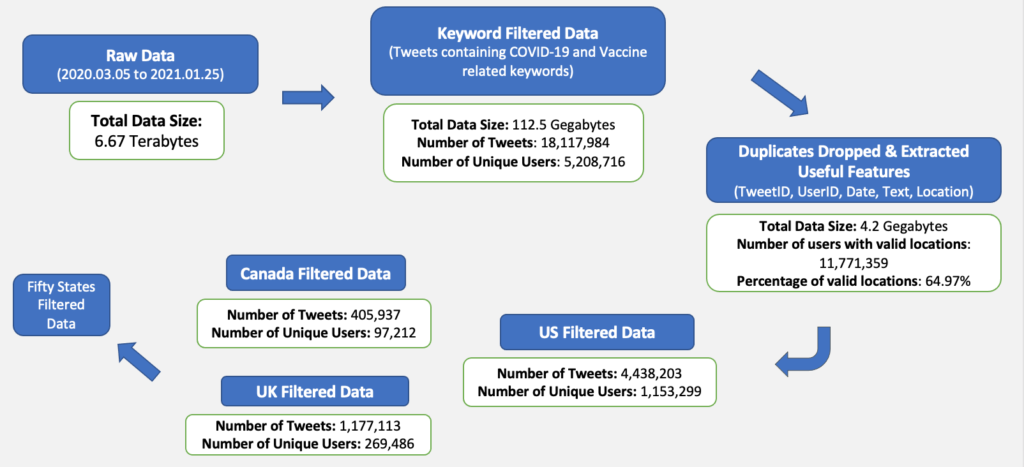
The original data size is 6.67 Terabytes. Our first step is to filter the data. We have filtered the data with only the tweets that contain COVID-19 and Vaccine related keywords. The remaining data size after the filtering is 112.5 Gegabytes. Our second step is to drop the duplicate data and features those are not important. After we clean the data, the data size reduced to 4.2 Gegabytes
Next, We have divided the data into three part in order for us to do analysis on different countries. We have the data for US, UK and Canada, we also have the data for all 50 different states in the US.
Exploratory analysis
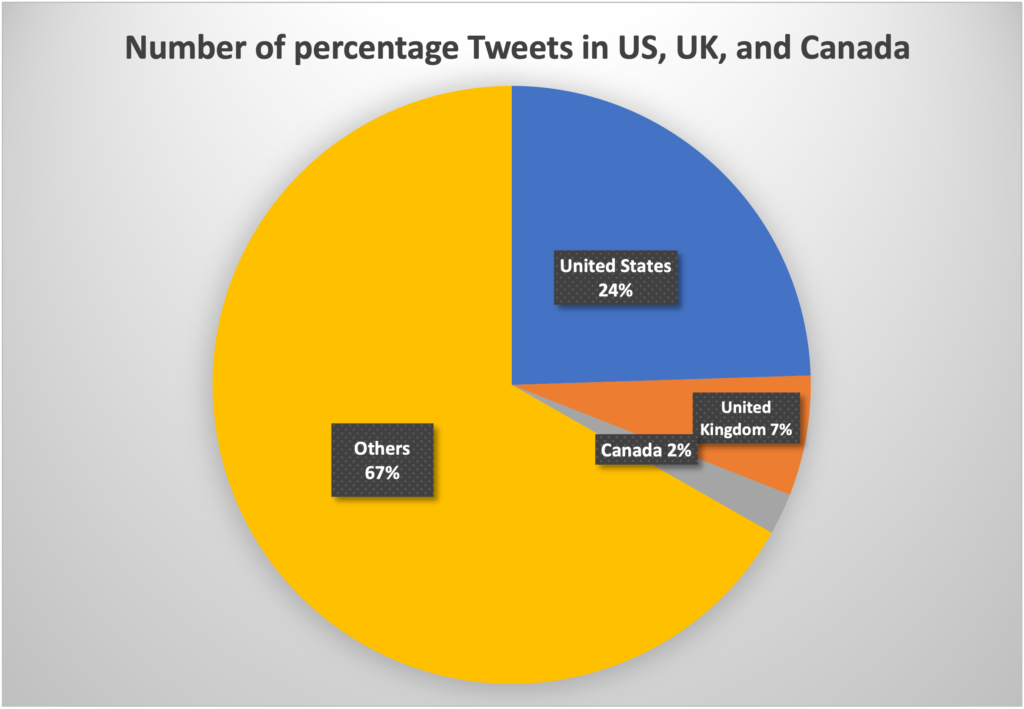
We have created a pie chart that shows the percentage for the number of tweets that are related to Covid-19 or vaccines for US, UK, Canada and the rest of the World. We found that the data from US takes 24% of the overall data, the data from UK takes 7% and the data from Canada takes only 2%.
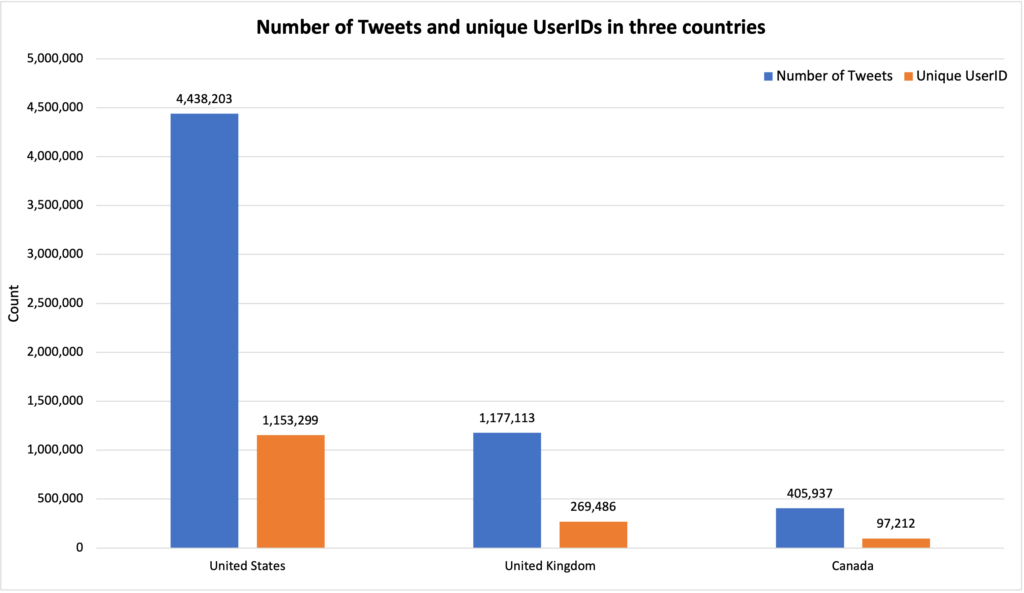
We then created a bar chart that shows the number of tweets and number of unique User ids in all three countries. US has about 4.4 million tweets and 1.2 million Unique user ids, UK has about 1.2 million tweets and 0.27 million Unique user ids, Canada only has about .4 million tweets and 0.1 million Unique user ids.
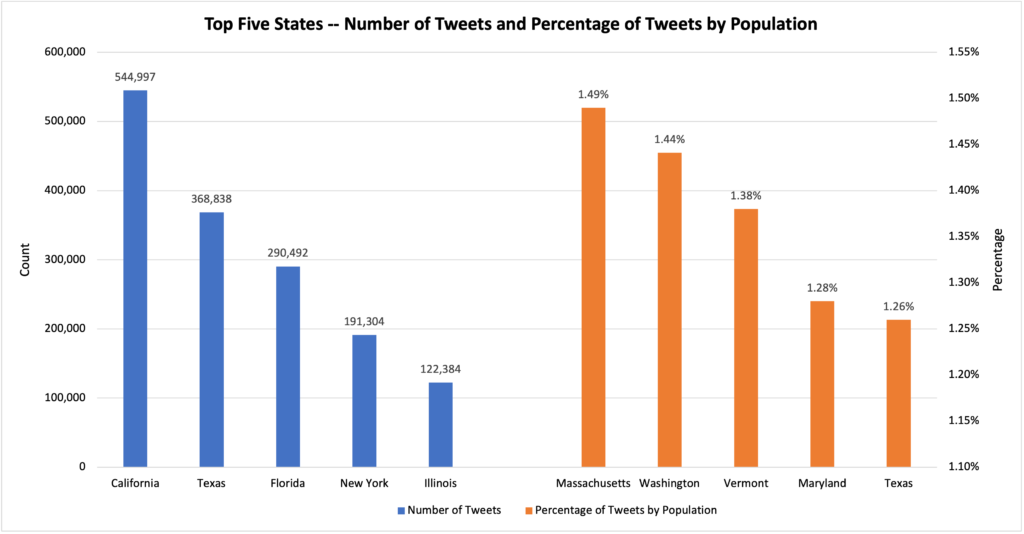
Finally, we did some exploratory analysis on state level and we created a bar chart that show the top 5 states with the highest number of tweets and the top five states with the highest percentage of tweets by population. And we got a conclusion that the States with high population does not necessarily has the highest relative percentage of Tweets.
Analytical Methods
This part explains the methods we use for the capstone project.
Longitudinal Analysis
We use Tableau to analyze the longitudinal features of our dataset. The reason we choose Tableau as our primary tool of data visualization is because it provides us a variety of choices to manipulate and visualize the dataset.
Sentiment Analysis
The VADER (Valence Aware Dictionary and sentiment Reasoner) was used for the sentiment analysis, which is a tool that is commonly used for sentiment analysis of social media data. We applied the vaderSentiment package in Python to calculate the sentiment score for each tweet and calculated the average sentiment scores by each week. For the text in each post, we extracted the compound score, which is normalized between -1 (negative extreme) and +1 (positive extreme). We also get rid of the words that may affect the objective score, such as virus and HTMLs.
Topic Modeling Analysis
Topic Modeling is typically used to discover abstract “topics” in documents through statistical modeling. To understand the most frequent topics that Twitter users were discussing about COVID-19 Vaccine, we applied Latent Dirichlet Allocation (LDA) for topic modeling analysis. To build the LDA model, several steps were conducted:
- Remove noises — emails, newline, extra spaces, distracting single quote and URLs
- Create bigram and trigram models — convert two or three words frequently occurring together in the document (e.g., difficulty_breathing, magic_johnson, catching_feelings)
- Remove stop words downloaded from nltk and make bigrams and trigrams.
- Lemmatization using spaCy — lemmatize the words to a normal form
- Create dictionary and corpus as LDA input and build the LDA model.
Demographic Analysis
This page is about how to conduct the demographic analysis. The Deepface algorithm were used to see how different groups of people, for instance, differdent gender, different age, different race, respond to the COVID-19 Vaccine. The Deepface algorithm is a face recognition algorithm that designed for differentiating and understanding figures. In detail, the following steps were executed to get the desired demographic data:
- Refilter the data to get the profile URLs. By using the profile URLs, we are able to download the profile picture to use for the algorithm.
- Filter the data into United State only.
- Download all the profile pictures.
- Apply the Deepface algorithm to get three features: race, gender, and age
- Combine the data with other features to perform sentiment analysis.
Results and Discussions
Perception of COVID-19 Vaccines in US
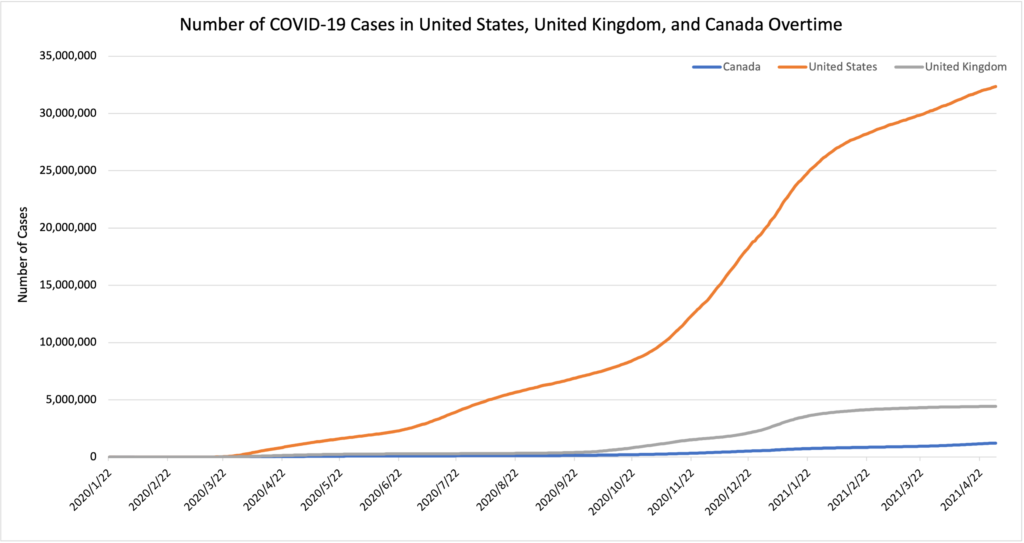
This longitudinal analysis plot was constructed by the number of tweets discussed on Covid-19 weekly from the start of March 2020 to the end of January 2021.

The popularity of discussion related to Covid-19 vaccine on Twitter is closely related to the U.S. government’s prevention policies and measures. In late March, twitter buzz on the topic rose when the U.S. reported over 100k Covid-19 cases. After 2 months in late May when the trend started to continuously go down, the lift of lockdowns and reopening of the economy brought people’s attention back to the ongoing pandemic for a short moment. By contrast to the early stages, starting in the last quarter, people’s attention/concerns rose much higher, as more progress has been made with vaccines. On Nov. 09 2020, Pfizer announced that its Covid-19 vaccine may be up to 90% effective. Another higher-than -ever discussion peak appeared on 12/24/20 when a possible easy transmissible new SARS-CoV-2 variant occurred from UK was reported.
The map below shows the number of Twitter users discussing Covid-19 vaccine normalized by state population for each state.
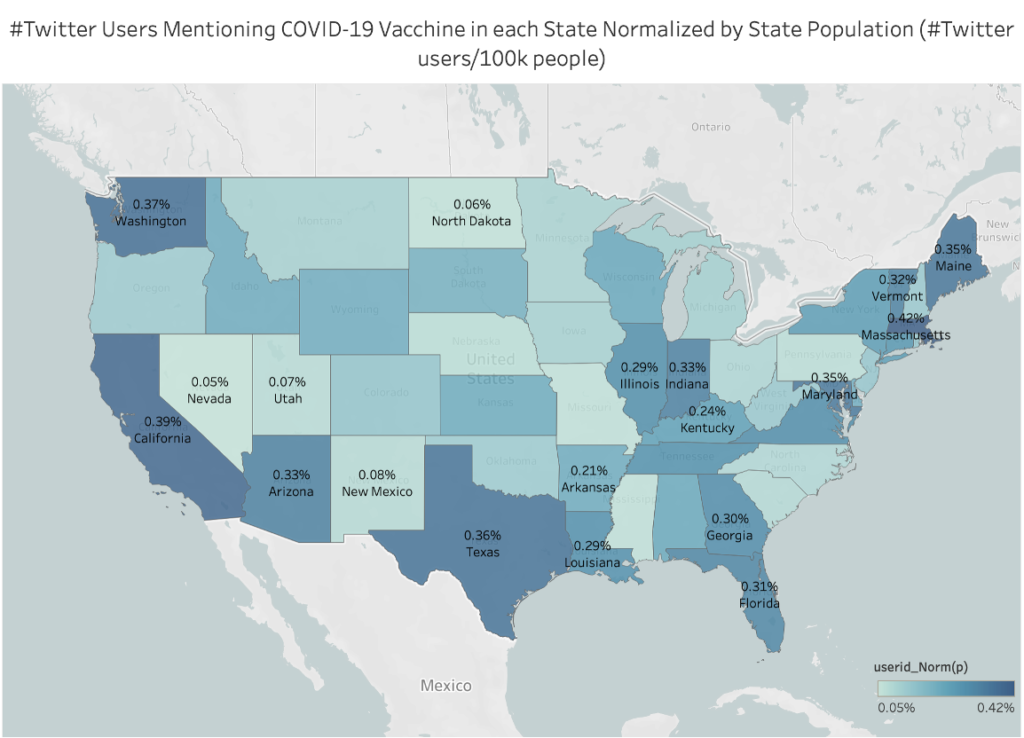
The value is calculated using number of unique twitter IDs divided by the state population. To conclude, people from coastal states are more active and concerned about the Covid-19 vaccine.
The sentiment score of Covid-19 vaccine over the US is calculated to see the public perspective on vaccines. The plot of of average sentiment score of US toward COVID-19 Vaccine is at below.

In the graph, the average sentiment score of vaccines in the US per week and the error bar calculated by the standard error of the means are presented. In general, the average sentiment sore varies a lot at the beginning and becomes more stable and close to zero as time goes on. The area between error bars is the standard error of the means(SEM); The standard error is calculated using standard deviation divided by the square root of sample size. Smaller SEM imply better accuracy. Two extreme peaks has shown here: the positive one is shown in early March, when optimistic news about COVID-19 vaccine development were released, while death rate shows a decreasing trend. The negative one is shown in late May, when the Black Lives Matter movement was heated.
LDA Results
In order to figure out the potential reasons that lead to the peaks in the average sentiment score’s trend overtime, we performed a LDA analysis for the two peaks. The week with the highest average sentiment score is from March 8 to March 14. Total number of Tweets from US in this week is 54,364.
Here is a table summarizing three major topics the Tweets are talking about.
| Dominant Topic | Keywords | Percentage | # of Documents being dominated |
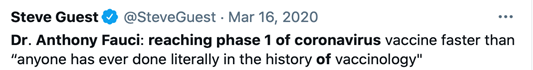
| 1 | vaccine, develop, free, ever, testing, scientist, ready, phase, fast, people | 50.43% | 27415 |
| 0 | vaccine, say, virus, flu, shoot, get, make, go, corona, people | 30.35% | 16498 |
| 2 | vaccine, find, help, fight, donate, salary, quarterly, flu, can, test | 19.22% | 10450 |
As the sample result introduced in the method part, we calculated the number of documents being dominated by each dominant topic and placed them in a descending order. Within each keyword list of topic, the words are arranged in a descending order based on frequencies. According to these keywords, we can see that the Tweets are mostly discussing about some positive news. For instance, based on the keywords in the top two dominant topic, we found a lot of Tweets talking about this news:
And if we look at the keywords in the third topic, we can find Tweets like:

In conclusion, positive news, such as vaccine development, and donation of salary, potentially lead to higher average sentiment scores.
We also performed a topic modeling analysis for Tweets in US from May 31 to June 6, which has the lowest average sentiment score, and the number of Tweets this week is 58,903.
| Dominant Topic | Keywords | Percentage | # of Documents being dominated |
| 0 | people, black, virus, live, dangerous, matter, none, airborne, start, say | 50.53% | 29,352 |
| 1 | need, say, bad, kill, make, develop, covid, apparently, nationwide, solve | 25.77% | 14,973 |
| 2 | find, doctor, continue, wait, futility, eventually, vaccine, covid, go, get | 23.70% | 13,768 |
From the keywords in each dominant topic, we can infer that the Tweets are mainly talking about the event of blacklivesmatter. And here are some representative Tweets found based on the keywords.
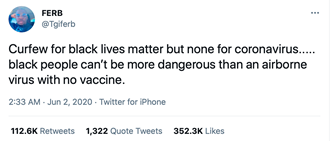
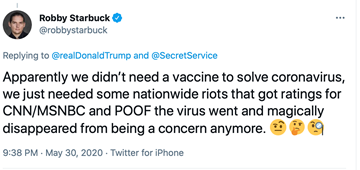
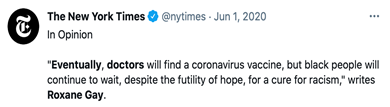
So apparently, people are associating the event of blacklivesmatter with COVID-19 vaccine with negative attitudes, which potentially is the reason of the negative average sentiment score in this week.
Demographic Analysis
In order to discover the demographic distribution from Twitter users in US, we performed a demographic analysis to get the age, gender, and race information. The number of unique users in US is 1,135,299, and we successfully extracted a 5% of valid user profile images to run the deepface algorithm. Here is a visualization of demographic distribution.
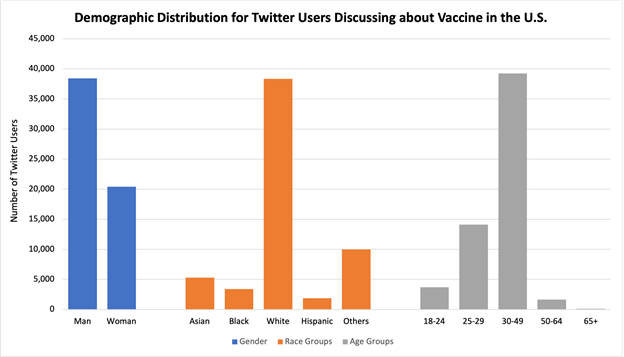
We can see that there are more males than females discussing about vaccine. And middle-aged people from 30 to 49 in US seem to have more discussions toward vaccine.
However, we found there is some problem with the accuracy of this deepface algorithm. We did an accuracy check manually on 150 profile images, and below is the agreement rate for each category. Overall, the agreement rate is around 47%, which is not ideally high.
| Demographic | Number of Agreements (/150) | Agreement Rate |
| Age | 93 | 62.42% |
| Gender | 127 | 85.23% |
| Race | 119 | 79.87% |
| Overall | 71 | 47.33% |
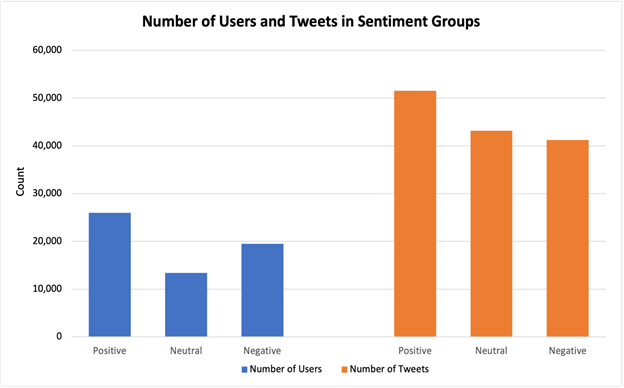
And here, the number of tweets from all users with valid profile images is around 3%. We performed sentiment analysis for each tweet, and also got the average sentiment score for every unique user. And then, we categorized the scores into three groups: Positive (0 to 1), Neutral (0), and Negative(-1 to 0). Overall, we can see that there are more users who have positive sentiment scores of Tweets. And there are more Tweets with positive sentiment scores.
Perception of different vaccines in US
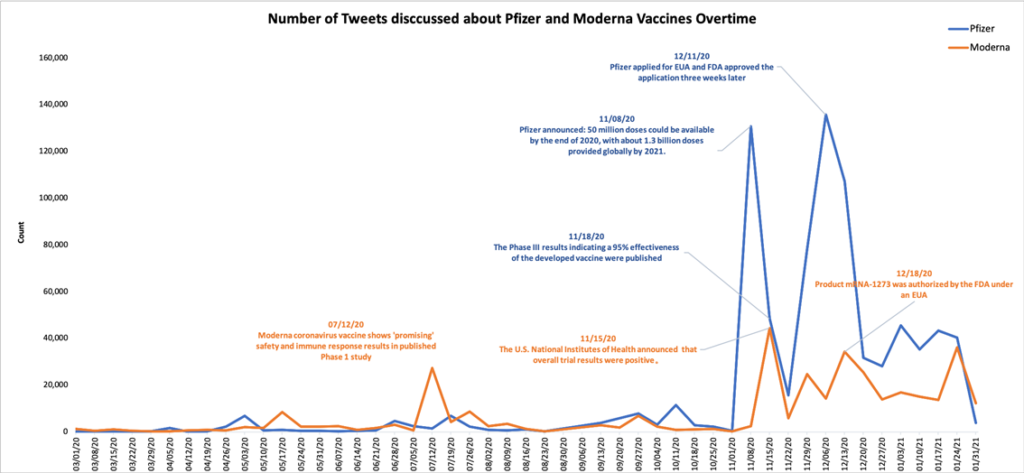
The graph below shows the number of tweets related to pfizer and moderna vaccines overtime. From the beginning of March to the end of October, the discussion of two vaccines are similar at a low level. Only in July 12th Moderna had a small peak since it shows promising safety and immune response results in published phase 1 study. However, in the last quarter of 2020, Pfizer vaccine received much more attention than Moderna. Most peaks of discussions are caused by related news. For example, on November 8th, Pfizer announced 50 million doses could be available by the end of 2020 and about 1.4billion provided globally by 2021. For Moderna, on December 18th, FDA issued Emergency Use Authorization for their product.
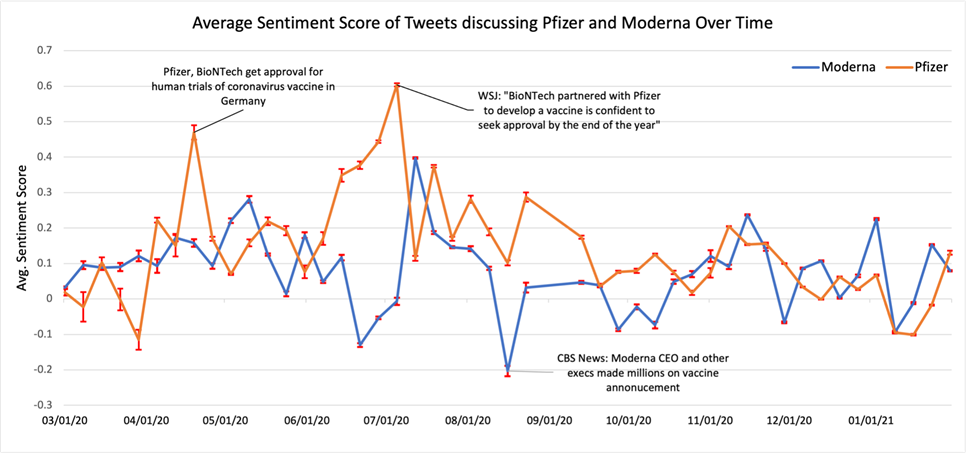
The graph below shows the average sentiment score per week of tweets for Pfizer and Moderna. Since there are limited discussions in the first 3 quarters, the sentiment scores vary a lot and the error is larger compared to those in the last quarter since it is highly associated with policies and news like we point out in the graph. The sentiment score of both vaccines at the last quarter have similar trends and are relatively stable.
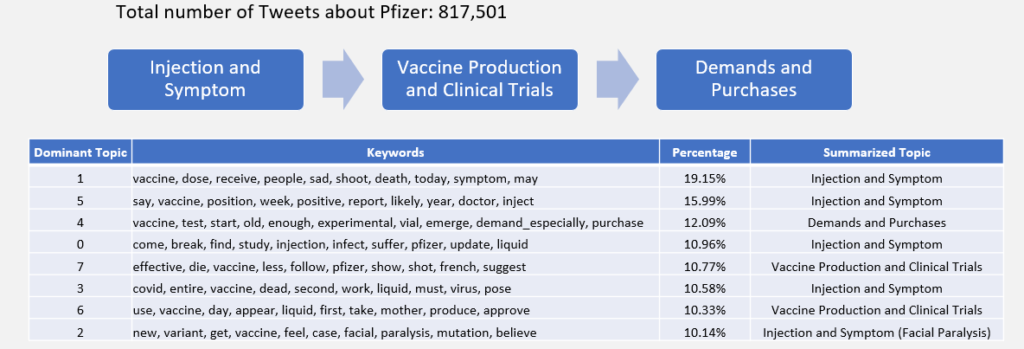
To figure out the most popular topics about the two vaccines, topic modeling analysis for Pfizer and Moderna are made. The total number of Tweets for it is over 817 thousand. The table summarizing 8 major topics the Tweets are talking about. We calculated the number of documents being dominated by each topic and ordered in a descending order. Within each keyword list of topics, the words are arranged in a descending order of their frequencies. Then we subjectively assign each topic to the summarized topic according to the keywords. According to these keywords, Tweets are mostly discussing the three topics, which are Injection and Symptom, Vaccine Production and Clinical Trials and Demands and Purchases.
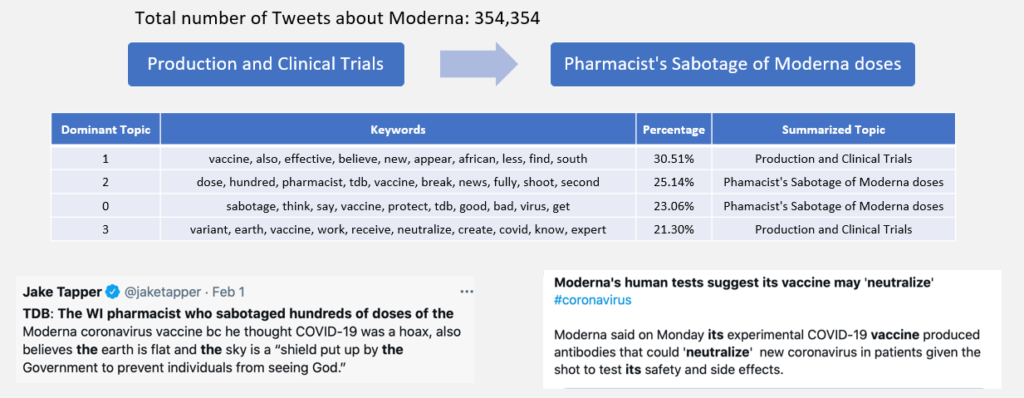
About Moderna, the total number of Tweets is over 354 thousand. The table summarized 4 major topics the Tweets are talking about. Compared to Pfizer, there is less discussion on the side effects of Moderna. And most of the tweets talked about production and clinical trials. Also, another topic stood out here, based on the keywords, is that there is a large amount of Tweets and news talking about the WI pharmacist sabotaging hundreds of doses of Moderna vaccine. Apparently this news has caught lots of attention.
Challenges and Next Steps
Challenges and Limitations
We encountered some challenges during the semester long capstone. Because the nature of the dataset, the preprocessing part is time consuming. Moreover, because of the massive amount of data, Bluehive is a better substitute than the personal computer. But this brings another issue, which is the responding time and loss of connection to the Bluehive. Since some of the team members are based in China, the internet speed is a huge trouble. We also spend a long time to du topic modeling because we have to much workload. Finally, because we want to achieve so many things with our interesting dataset, we tried a lot of methods, so we have to adjust the codes and debugging all the time.
Although social media provides first-hand users’ perspectives, it does not provide controlled variables. We don’t have the user demographic information, including age, gender, and education, etc. Twitter users can’t represent the whole population, since about only 20% of US adults are currently using Twitter. And the accuracy of the deepface algorithm is relatively low. Furthermore, our study only focused on a certain period of COVID-19 epidemic in the US, and the story might evolve later.
Next Steps
For the next step we will be focusing on wrap up our whole project. Firstly, we will finish the project by improving the accuracy of demographic analysis tool and in the meantime to find some other interesting insight if possible. Then we will be working on the research paper with our sponsor professor zidian and try to find some platform to publish our paper.