People
Our Team

Frank Gonzalez
Data Science | Class of 2021

Luke Nau
Data Science | Business Analytics |Class of 2021

Christopher Pak
Data Science | Class of 2021

Erika Ramsdale
Geriatric Oncologist

Khoa Hoang
Project Manager
Data Science | Microbiology | Class of 2021
Supervisors
Prof. Ajay Anand
Prof. Pedro Fernandez
Sponsor
Dr. Eva Culakova
Project
Our Vision
The Geriatric Oncology Research Team at URMC wants to better understand chemotherapy tolerability in vulnerable older adults.
Key Objectives:
- Identify the factors associated with chemotherapy tolerability in older adults
- Develop and compare models to predict the 3-month Relative Dose Intensity (RDI) of chemotherapy in a cohort of vulnerable older adults with advanced cancer
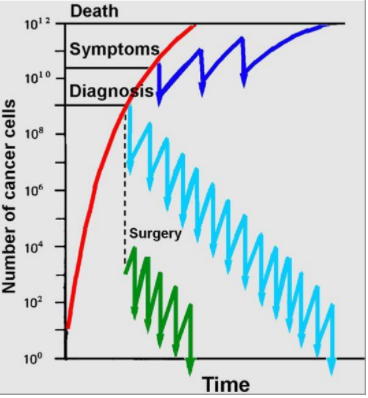
Background
- Relative Dose Intensity (RDI) is a ratio of received and expected chemotherapy over time
- RDI is usually between 0 and 1
- A high RDI is associated with survival time
- RDI >85% is important for curable cancers
- RDI>65% may be important for incurable cancers
About the Data
- 718 older patients with advanced cancer (rows) enrolled between 2014 and 2019 on a national, cluster-randomized clinical trial
- Our starting dataset: 130 features (out of ~2600)
- 10 paired features (one continuous, one dichotomous)
- 8 yes/no features for geriatric impairment
- 67 symptom attributes across 26 distinct symptoms
| Measures | Features included |
| Study | Study arm (GA intervention or control) |
| Demographic | Patient age, gender, race/ethnicity, education level, marital status, income, who lives in household |
| Cancer | Cancer type and stage |
| Treatment | Treatment type, whether treatment is considered “standard of care” per guidelines, receipt of prior chemo or radiation, current receipt of oral, hormonal, or monoclonal antibody therapies, how certain patient feels about benefit/risks |
| Treating oncologist | Physician age, gender, years in practice, and number of days in clinic per week |
| Geriatric assessment domains | Multiple validated instruments for 8 domains of functioning (physical, other health problems, medications, nutritional, social, psychological, cognitive). |
| Symptoms | Baseline presence, severity, interference, and/or frequency of 26 patient-reported symptoms |
Exploratory Data Analysis
The primary focus of our exploratory data analysis can be divided up into 2 main parts:
- To observe the feature set, and determine which features are important to our response variable.
2. To observe to see strong cases of multicollinearity between our features.
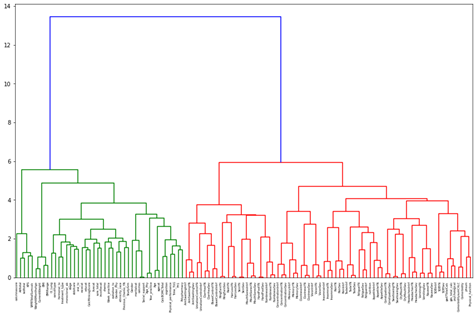
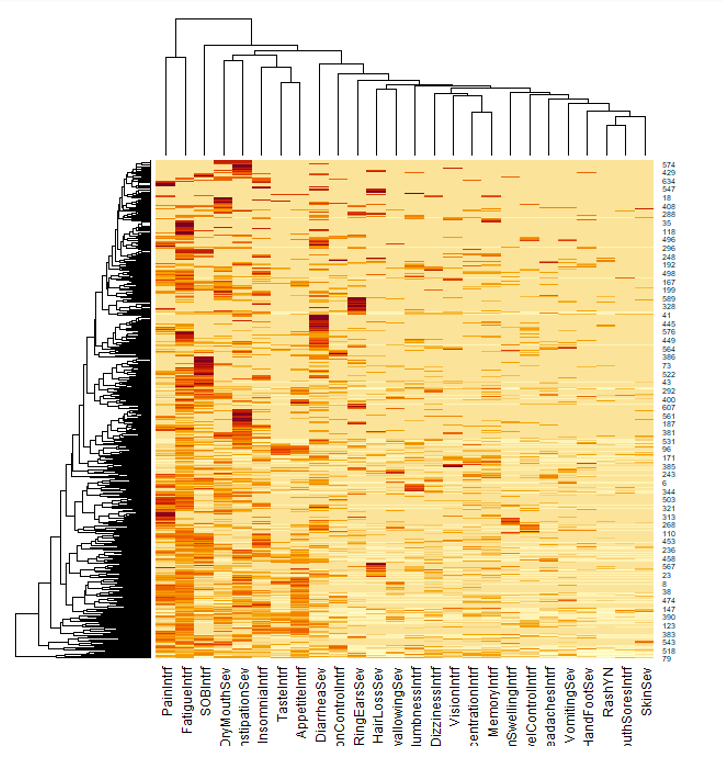
Initially, a Hierarchical Dendrogram and Spearman Correlation matrix were used to explore the clustering and correlation of features. A feature selection method called Variance Inflation Factor (VIF) was used as a preliminary observation into what features were removed instantly.
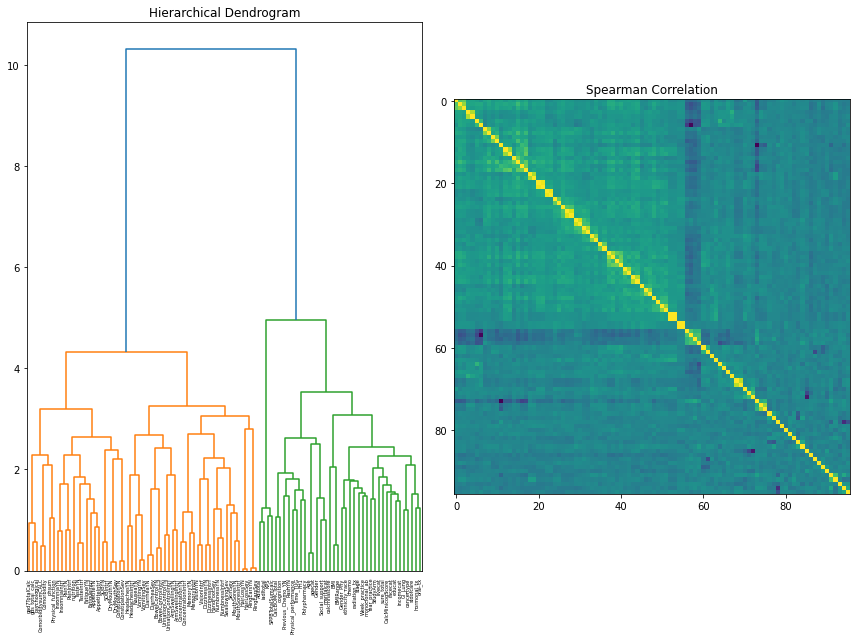
For the dendrogram interpretation, it was found that the two major clusters present are between symptom data and the independent feature measures (procedures, demographics, treating oncologist, and geriatric assessment). This reaffirmed the notion that there was still more consideration to be done in combining, selecting, and removing features based on a consensus of other feature selection methods available and clinician perspective.
Our correlation matrix further adds on to this as the small “boxes” of high correlations are essentially variations of symptom data (is present, severity, interference).
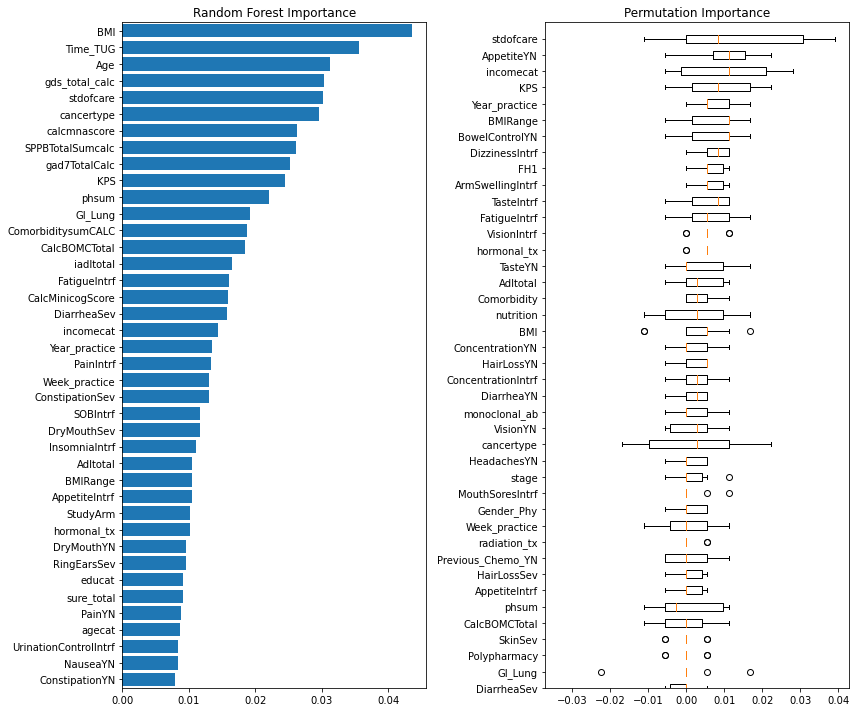
The final method used to observe our feature set was looking at different importance metrics. The two importance metrics used were Permutation Importance, and Random Forest Classifier’s feature importance. The reasoning behind these importance values were that permutation importance tends to generalize better to smaller feature sets, and that the Random Forest model was a model of interest within the project.
Preprocessing
The presence of missing values in both response and predicting variables and the presence of nominal, ordinal, and continuous features with different ranges in the dataset required appropriate preprocessing strategies. To determine the optimal preprocessing strategy for model performance, we developed a Preprocessor class in which different preprocessing strategies could efficiently experiment.
Although not resulting in significant differences in model performance, one-hot encoding is generally more suitable for nominal variables since it does not presume any order in different categories. With the low number of nominal features in this dataset, one-hot encoding would merely affect data sparseness. Since responses are distributed randomly, preserving these records with median imputations will gain more information on the distributions of predicted features. Scaling is often recommended for models relying on the distance between features. In conclusion, in preprocessing this dataset, ordinal features were encoded according to their orders. Nominal features were one-hot encoded. Missing values were imputed with corresponding feature medians. And all predicting feature values were scaled using the min-max scaling method
Feature Selection
The feature set had 130 features, and many of these features were removed to make the model more interpretable and more accurate.
There were two main steps to the feature selection:
- Feature removal based on clustering and domain knowledge:
Agglomerative clustering was used group similar features. Then from this set of clusters, several features were selected from each cluster from a clinical perspective. The feature set was pruned from 130 features to 67 features.
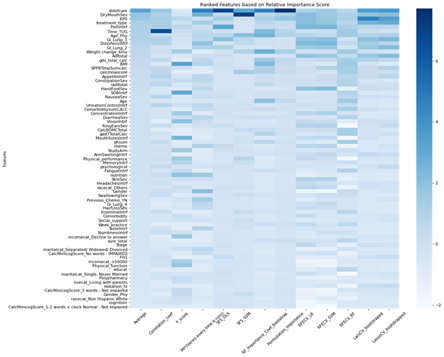
2. Feature selection method comparison and ranking:
There were 15 different feature selection methods used on the newly pruned data set. All features were assigned importance values from each of the methods and were ranked by the average of all importance values
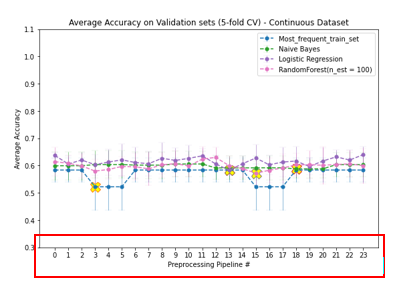
Model Performance
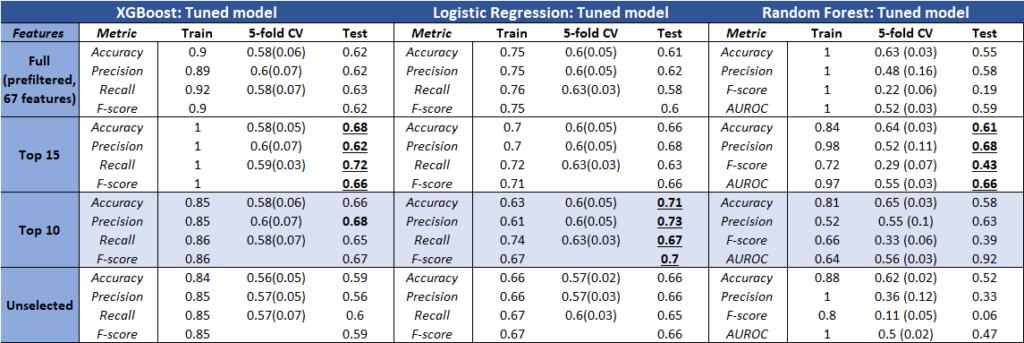
The table above represents the results of the most promising models. Using a combination of both, we obtained the optimal parameters from the search methods onto fitted models (train set).
Model Interpretation
It was interesting to see that some models performed better than others based on the selected features. However, logistic regression achieved consistent results, and also the highest accuracy (closest score range based on other clinical reports).
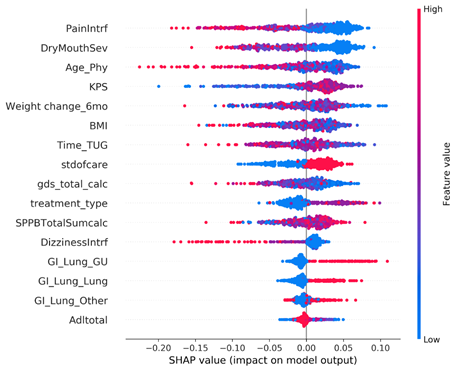
Although the model metrics that were tested were not very high, there were many interesting features that the models picked up for most important features. There was interestingly not a prioritization over symptoms data, and features that were not expected to show up, like age of the physician, were surprisingly highly valued by our model.
Key Insights
- All the models performed about the same on this dataset
- Nothing really out-performed logistic regression
- Most interpretable model for clinician readers of our results
- Although there was some variation, we identified important features that showed up across most models and methods
- Whether the treating oncologist decreased the dose up-front (stdofcare feature)
- Weight loss and BMI
- Performance status (KPS)
- Baseline symptoms (pain interference, dry mouth severity, dizziness interference)
- Age of the treating physician ←(this is a really interesting finding)
- Age of patient was not a strong predictor of outcomes in this dataset
Future Directions
Explore symptoms data:
Clustering of symptoms data shows some interesting patterns that could be further explored. Each row represent a patient and each column represents a symptom
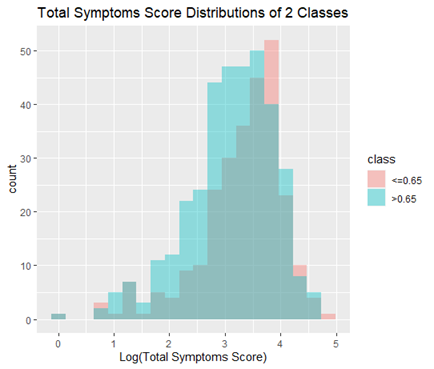
More of feature engineering:
In this project, we created a new feature “weight_change_6mo” which was in the top 10 best features resulting from our ensemble feature selection method. Therefore, engineering more features like this could improve our model. One such idea is adding scores across all symptoms to generate a “total_symptoms_score” feature, which turns out to be significantly (statistically) different between the 2 classes. (p = 0.0019, t-test)
Explore standard of care as the response variable
Standard of care is another response that would be meaningful to model. Data of this feature is obtained concurrently with other features in this dataset (except for RDI), therefore could yield higher accuracy.