Augmented Acoustic Environment Affects IC Units
In this experiment, the first group ('Control') was not exposed to AAE, and remained in the animal housing facility until testing. The second group ('RegularAAE') was exposed starting just after birth, before the onset of hearing around P10, and continued to be exposed through the test date. The third group ('On/Off') also began exposure just after birth, but were removed from exposure at P30 and returned to the traditional animal housing facility until testing. The final group ('Off/On') was housed in the traditional animal housing facility until P30, and then placed in the exposure booth from P30 until testing (P60).
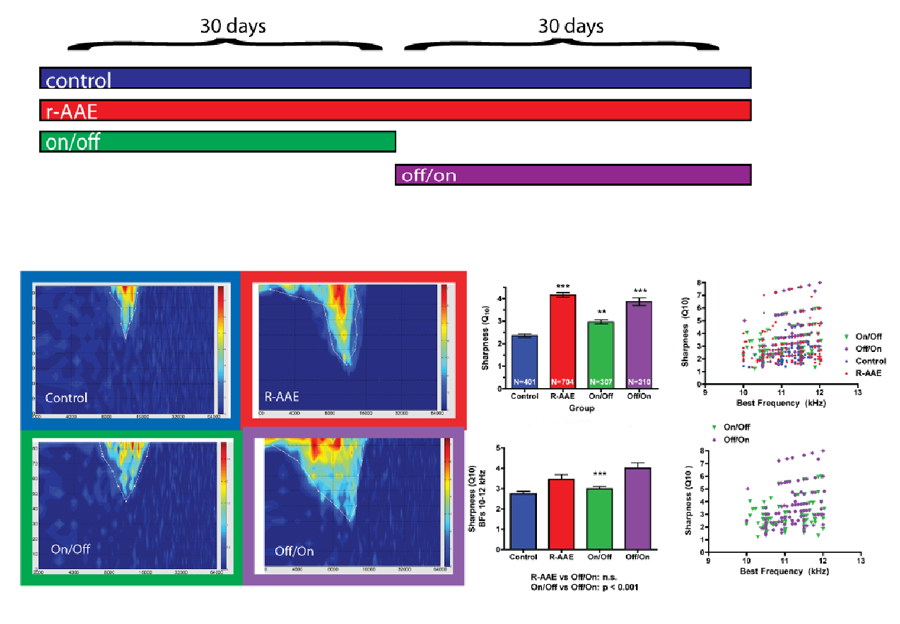
Figure 1. Four representative examples of FRAs from a control mouse (blue border), from a mouse exposed to regular AAE for 60 days (red border), from a mouse exposed to AAE for 30 days on/off fashion (green border), and a mouse exposed to AAE for 30 days commencing on P30 (off/on-purple border).
In Figure 1, displayed is the mean Q10 for all of the units (Ns are shown at the bottom of each bar) for the control group and three exposure groups. Mean Q10 are significantly broader for the control group as compared to the AAE exposed groups. Surprisingly, the mean Q10 for Off/On group was similar to regular AAE indicating that delaying the start of AAE exposure by 2 weeks has no deleterious effect on frequency selectivity as measured by Q10. The lower panel shows statistics for units with best frequencies (BFs) between 10-12 kHz. Q10 is plotted as a function ofBF for all units within the 10-12 kHz region, and the lower panel shows Q10 as a function of BF for the on/off and off/on conditions.
Researcher: Anne E. Luebke, Ph.D.
Role of cochlear outer hair cells in hearing and hearing loss, at both the molecular and systems levels